Overview
Asset management goliath BlackRock (NYSE:BLK) had a mixed, yet solid, start to its year, with net income dropping 19.43% y/y while AUM increased 5.8% q/q to $9.1 trillion. The firm’s base management fees (non-performance portion) decreased 9% y/y to $3.5B. These figures amounted to 5% annualized organic asset growth and 1% organic base fee growth.
BlackRock’s unique role as a leader in the alternative investments space makes it an interesting company to watch during the current economic context. As financial pressures and consumer flight continue to ripple across the banking sector, it is reasonable that BlackRock may stand to benefit from an asset capture perspective. The universe of alternative investment vehicles, within which BlackRock is a leader, could very well provide the combination of security and yield that investors are seeking in this current environment.
The firm’s latest quarter of ongoing increases in its assets under management indicates that it indeed continues to be a destination for capital in these turbulent times. This performance extended strong results from 2022, in which BlackRock received $307B in net asset inflows and captured roughly 1/3 of long-term industry aggregate flows. Along with this, the company’s massive exposure to fixed income products has made it a direct beneficiary of ongoing rate increases – something the company’s President referred to as a ‘once in a generation opportunity’ on its latest conference call:
This is really a once in a generation opportunity in fixed income and clients have been over the last many years, because of low rates, underweighted in fixed income. So at BlackRock, we are very well positioned with our $3.3 trillion fixed income and cash platform.
This article will review BlackRock’s fundamental positioning and see where the stock should be headed.
Fundamentals
Given BlackRock’s tenure as a public company (IPO 1999) we can sensibly review annual financial data going back a decade.
Here we see a decade of choppy top line growth, with a notable acceleration in 2020 that petered out in 2022. What is interesting about this trendline is that BlackRock hit double digit growth in 2020 while already being such a large enterprise ($16.2B revenue that year). Revenue growth subsequently showed an additional year of acceleration to 19.56% before last year’s 7.75% decline.
Seeking Alpha Seeking Alpha

These last 3 years appear distinct relative to BlackRock’s operating history and I would be cautious around extrapolating them for the time being. If anything we can garner that this company can still grow at its size, but that it also can very well shrink. The high y/y revenue growth volatility is common across large financial services firms with significant exposure to alternatives (see Goldman Sachs).
This growth has occurred with somewhat lower gross margins long-term, with an average gross margin around 50% in recent years. This represents a decline from the 54% the firm was able to generate during the first 3 years of the decade, but has held steady at this new level.
Seeking Alpha
Operating margins decreased by a similar amount over that time period and fluctuate across the 35-38.5% range primarily.
Seeking Alpha
Interestingly, net margins have proved more variable than gross or operating margins and are closer to their decade average of 30.11%. This decade-long average, as well as BlackRock’s latest yearly net margin of 28.97%, continue to exceed the financial sector median of 25.80%.
Seeking Alpha
Valuation
Altogether these results have yielded consistent growth in the company’s earnings per share. Using a 3 year CAGR to smooth out y/y volatility, we can see that BlackRock generated double-digit EPS growth 4 years out of the last 7 on a rolling basis.
|
Fiscal Year |
2013 |
2014 |
2015 |
2016 |
2017 |
2018 |
2019 |
2020 |
2021 |
2022 |
|
Diluted EPS |
$16.87 |
$19.25 |
$19.79 |
$19.02 |
$30.12 |
$26.58 |
$28.43 |
$31.85 |
$38.22 |
$33.97 |
|
3 Yr EPS CAGR |
4.08% |
16.09% |
10.33% |
14.34% |
1.88% |
12.87% |
6.11% |
Source: Excel, Seeking Alpha
Taking the average of the last prior 3 years 3-year CAGR, we can establish a reasonable forward-looking EPS CAGR of 6.95%. Extrapolating this forward by a decade, we can see that BlackRock is priced well into the future at this growth rate; it would still be trading at a premium to the financial services sector median P/E multiple in 2032.
|
Fiscal Year |
2023 |
2024 |
2025 |
2026 |
2027 |
2028 |
2029 |
2030 |
2031 |
2032 |
|
Diluted EPS |
$36.33 |
$38.86 |
$41.56 |
$44.44 |
$47.53 |
$50.84 |
$54.37 |
$58.15 |
$62.19 |
$66.51 |
|
P/E at $635 |
17.48 |
16.34 |
15.28 |
14.29 |
13.36 |
12.49 |
11.68 |
10.92 |
10.21 |
9.55 |
|
P/E % of Sector. Fwd. (8.52) |
205.14% |
191.81% |
179.35% |
167.69% |
156.80% |
146.61% |
137.08% |
128.17% |
119.84% |
112.05% |
Source: Excel, Seeking Alpha
This leads me to conclude that BlackRock is fairly priced at the moment. Given the changing landscape, however, I also think it makes sense to establish both a bull case here. Given the firm’s historical revenue volatility, a trend that has seemingly increased in recent years, indicates that fluctuations to the upside are possible and even quite probable.
The bull case involves BlackRock continuing to acquire client assets briskly while seeing structurally higher net income yields due to its fixed income and alternative asset exposure. I will assume that this creates a forward EPS growth rate of 10.43%, a number which is at the low end of historical high growth periods for BlackRock and is 150% of the base case EPS growth rate of 6.95%.
This creates a different profile for the firm long-term. While still relatively expensive on this basis, the firm would now be priced less than 10 years but would only become intrinsically cheap in 8 years – assuming no share price growth during that time. This wouldn’t be too exciting for an investor seeking share price appreciation in my view.
|
Fiscal Year |
2023 |
2024 |
2025 |
2026 |
2027 |
2028 |
2029 |
2030 |
2031 |
2032 |
|
Diluted EPS |
$37.51 |
$41.43 |
$45.75 |
$50.52 |
$55.79 |
$61.61 |
$68.03 |
$75.13 |
$82.96 |
$91.61 |
|
P/E at $635 |
16.93 |
15.33 |
13.88 |
12.57 |
11.38 |
10.31 |
9.33 |
8.45 |
7.65 |
6.93 |
|
P/E % of Sector. Fwd. (8.52) |
198.68% |
179.91% |
162.92% |
147.53% |
133.60% |
120.98% |
109.55% |
99.21% |
89.84% |
81.35% |
Source: Excel, Seeking Alpha
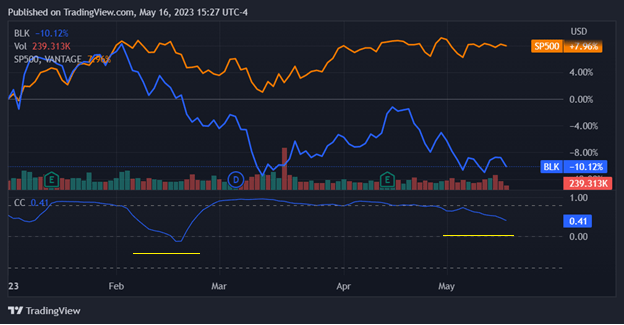
Interestingly this relatively expensive valuation stands even as BlackRock has sold off YTD, materially trailing the S&P500 Index. Worth noting is that BlackRock’s sell-off earlier this year coincided with a break in its standard monthly correlation to the S&P500. While monthly correlation then resumed historically normal levels of around 0.8, it appears to have fallen off again over the last 30 days. This indicates that the market has been selling off BlackRock specifically even as the index has stayed relatively constant.
Seeking Alpha
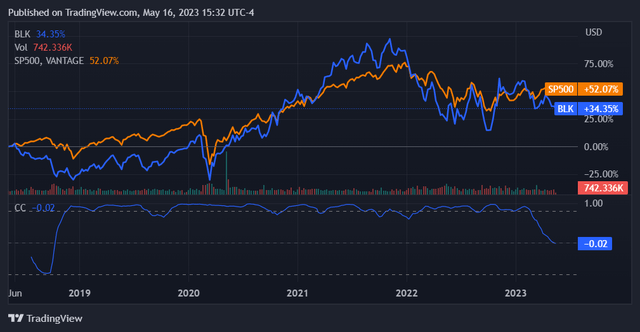
Looking at this trend over a 5 year horizon, we see that BlackRock tends to fluctuate and persist at some level either above or below the S&P500. The disrupted, even negative, correlation is not something that we have seen since late 2018.
Seeking Alpha
While this changing correlation is likely a technical blip due to pessimism around the firm’s earnings, I am not convinced that BlackRock’s business deserves to be trading at a price return discount to the S&P500 this year. This is potentially a tactical mispricing.
Conclusion
BlackRock’s stock is like its business: good for capital preservation. While I don’t think there is going to be a level of share price appreciation that would interest growth investors, I think this is a company that can be expected to continue growing EPS no matter which way the economy goes. The nature of its business, essentially a massive portfolio, should allow for this.
The near to medium term outcome here is buoyed by the company’s large holdings of fixed income instruments acting to preserve returns. This positioning, along with its proven ongoing ability to take in capital/fund flows, should serve as a hedge in what is expected to be a relatively turbulent economic period. Along with the company’s 3.10% dividend yield, this makes BlackRock a quality defensive buy at this particular juncture in the macroeconomic context, in my opinion.
Read the full article here


