Thesis Summary
The S&P 500 (SPX) has been trading range bound for the last couple of weeks, and this is setting us up for a big move up or down.
I am positioned for up and will be actively buying the dip if we come down meaningfully from here.
Below, I present 4 charts that are behind my bullish conviction. These address both the fundamentals and technicals of the stock market in general.
The SPDR S&P 500 ETF (NYSEARCA:SPY) is my preferred vehicle to gain a balanced exposure to a bullish move.
Inflation Tamed, For Now
Last week we saw the latest CPI numbers, and this showed a continuation of the current disinflation trend. YoY inflation eased to 4.9%, below estimates, and MoM inflation was 0.2%.
Like a lot of analysts, I now believe that inflation has been tamed (for now), which opens the door to a pause in rate hikes, and rate cuts further along. Perhaps the main reason I believe this can be seen in the chart below.
M2 and CPI YoY change (longtermtrends)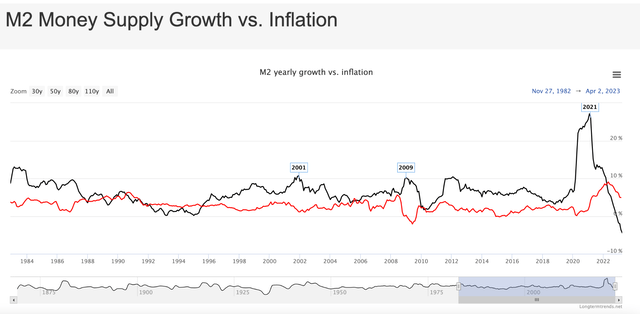
M2 is a measure of money, which includes cash, checking deposits, and other forms of money that are readily convertible to cash, such as CDs and MMFs. We can see that M2 yearly growth topped in 2021, and has trended down sharply ever since.
This rapid reduction in the broad money supply should drag down inflation with it, and in fact, it has. Inflation has been cooling off since around 2022. There’s a clear correlation between M2 and Inflation if we account for about a 12-16 month lag.
In other words, if we were to push the M2 line a little to the right, we would see them move almost perfectly in sync.
So, if M2 is indeed a leading indicator for inflation, then we should expect a continued trend down over the next few months, which opens the door to a pause and lower rates, something the market is likely already expecting.
S&P 500 Technical Analysis
We have some reasons to be bullish fundamentally, now let’s look at the technical picture of the SPX chart.
SPX TA (Author’s work)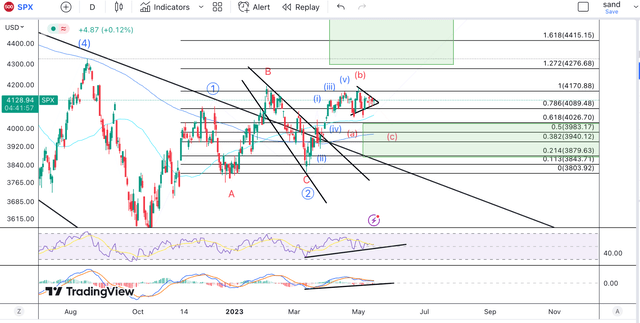
The SPX has come a long way since it put in a bottom in October, and it has established an undeniable uptrend.
Our first bullish signal came when we broke above the 50 and 200 day MAs at the start of the year, and this was further confirmed when we broke above the long-term trendline seen in black.
Though we did dip below in March, we are once again convincingly above all these key levels. The 50 and 200 day MAs are now offering us strong support at 4040 and 3980, and these would be levels I’d buy if we came down to them.
From an Elliott Wave perspective, I believe we could be forming a bullish 1-2 inside a larger 1-2. Now, I would have liked to see a deeper retracement in the smaller wave 2, which I still haven’t discarded, but I am also open to the possibility that we break out directly.
This would put us in a wave 3 inside the larger wave 3, which should give us an aggressive move to the upside.
Peak Bear sentiment
Now, here’s another chart that makes me bullish. This one is perhaps both technical and fundamental.
AAll bears and bulls (Hi Mount research)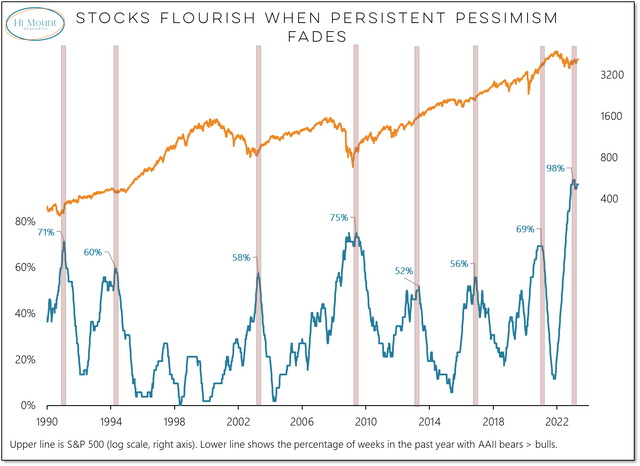
In the chart above, we can see the S&P 500 in orange and below it the percentage of weeks in the past year where AAll bears have been above bulls. AAll is a sentiment survey. And this chart shows the peaks in bearish sentiment.
As we can see, peaks in this bearish sentiment have coincided with the beginning of bullish runs in the past. You might call this a contrarian indicator.
Is this 2006?
Though history doesn’t repeat itself exactly, it does rhyme:
SPX, rates and employment 2006 (Author’s work)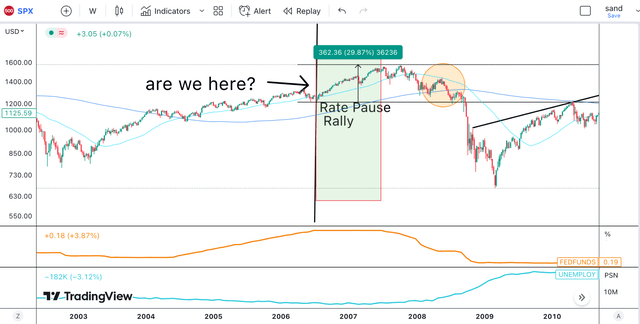
This chart shows how SPX performed ahead of the 2008 financial crisis. We can also see the Fed funds rate in orange and below it, the inflation rate.
Back in 2006, we got a rate pause rally. The Fed kept rates the same for over a year, and the market used this opportunity to rally near 30%. At this point in the business cycle, employment was still strong, as it is today, though cracks began to appear in 2007.
Today is similar in many ways. I believe a lot of investors are concerned about a recession and the recent banking crisis. I think this definitely opens us up to a big correction, such as what we saw in 2008, but before that happens, the market could push significantly higher.
Bonus chart
Now, to finish up, here’s a bonus chart and another comparison from history. This time a few decades further back.
SPX 1970s, inflation rates and employment (Author’s work)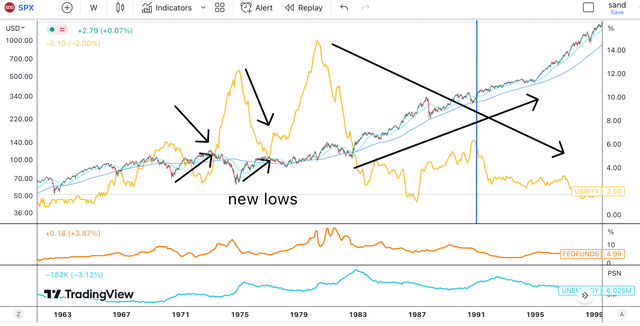
In the 1970s, we also saw high inflation, and there are two points that stand out to me.
First off, there was generally a correlation between periods of disinflation and market rallies, and I believe this is what we could be getting now.
Most importantly, though, inflation came in three different peaks spread out throughout a whole decade, and this is something we could witness again in this one. Though I see inflation coming down now, the Fed could easily, once again, over-stimulate the economy, and inflation could ramp back up as it did in the 70s.
Going long SPDR S&P 500 ETF
For the time being, I think that US equities are poised to head higher. A lot of the European indexes are already at all-time highs, and the US should catch up soon. The SPDR S&P 500 ETF is an easy and cost-effective way of gaining exposure to US equities. There are arguments to be made that tech stocks could outperform in a “risk-on” environment and that perhaps the Nasdaq (NDX) could be a better investment.
However, I like the SPDR S&P 500 because it also offers exposure to commodities and financial stocks, which I believe are quite oversold at the moment.
But what would make me change my view? Fundamentally, I would have to see a material worsening in the US economy or evidence that inflation is picking up.
From a technical perspective, I’d become weary if we break below the 50 and 200-day MAs.
For now, though, I will buy the dip and also continue to accumulate quality names in the tech, commodity and energy spaces, as well as increasing my holdings of crypto assets.
Read the full article here


