I was discussing FinTech companies the other night with some people, and there was an overwhelming feeling that shares of PayPal Holdings (NASDAQ:PYPL) were undervalued. I am not a shareholder of PYPL, but I considered PYPL a top contender for capital appreciation in 2023. I wanted to go back and revisit my investment thesis as PYPL’s share value has declined -11.11% since I wrote my previous article on 12/16/22 (can be read here). In less than two months of the article, PYPL had increased to $86.96, a gain of $17.56 or 25.3% on 2/2/23, only to decline to the low $70s before freefalling after earnings into the low $60s. While I am not a shareholder, I am very intrigued by the potential opportunity. For those who are wondering why I never pulled the trigger, it’s fairly simple. I have a lot of exposure to technology companies and increased my exposure to Meta Platforms (META), Amazon (AMZN), Palantir (PLTR), and SoFi Technologies (SOFI) rather than starting new positions. Well, shares of PYPL haven’t been this low since September of 2017, so I went through the numbers, and I will be starting a position within a few days of this article being published.

Seeking Alpha
PayPal hasn’t been this cheap since September of 2017, so let’s take a look under the hood.
PYPL was a pandemic superstar, falling to $86.68 on 3/16/20 and skyrocketing to $298.37 less than a year later on 2/8/21. PYPL dropped a bit and made another run, topping out around $308.53 on 7/19/21. In about 16 months, PYPL had appreciated by $221.85 per share (255.94%) since its pandemic lows. As quickly as shares reached their highs, the gains evaporated, and over the next 22 months, shares lost -80% of their value, declining by -$246.84 to $61.69. What’s crazy is PYPL isn’t an unprofitable tech company or a company that needs to prove its viability. For me to allocate capital toward PYPL rather than another position I believe in for capital appreciation or a dividend play to increase my passive income, I need to determine if PYPL is a broken stock or a broken company.

Seeking Alpha
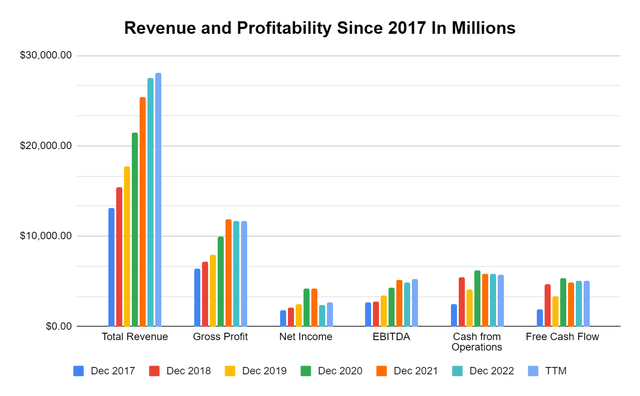
PYPL doesn’t fit my definition of a broken company after going through the financials. You would have to go back to the fall of 2017 to see PYPL at the current valuation, so I will evaluate the progress PYPL has made since the close of 2017. Using the TTM as the most recent year, over the past five years and one quarter, PYPL has grown its revenue by $14.98 billion (114.41%). PYPL didn’t sacrifice growth for profits as this company is very profitable. In the TTM, PYPL has delivered $11.72 billion of gross profit, which is an increase of 83.11% since the close of 2017. On a profitability level, PYPL has squeezed $2.71 billion in net income from its TTM revenue, an increase of 50.7% since 2017. PYPL’s EBITDA has increased 95.13% to $5.29 billion, its cash from operations has increased 127.82% to $5.77 billion, and its free cash flow (FCF) has increased 172.59% to $5.08 billion. From my perspective, broken companies don’t generate ongoing revenue and profitability growth while delivering $18.01 billion of net income, $25.87 billion of EBITDA, $33.15 billion of cash from operations, and $28.45 billion in FCF over a five year and one quarter period.
In addition to the top and bottom line growth, PYPL also has strong margins. If you read Warren Buffett and the Interpretation of Financial Statements on page 34 of the Kindle edition, it says:
” As a very general rule (and there are exceptions): Companies with gross profit margins of 40% or better tend to be companies with some sort of durable competitive advantage. Companies with gross profit margins below 40% tend to be companies in highly competitive industries, where competition is hurting overall profit margins (there are exceptions here, too).”
PYPL passes Mr. Buffett’s gross profit margin threshold as its gross profit margin is 41.73% from the TTM numbers ($11,717,000,000/$28,075,000,000). PYPL operates at an 18.84% EBITDA margin, and on a GAAP profitability level, PYPL operates at a 9.63% profit margin. Out of every dollar that PYPL generates of revenue, they have a 20.54% cash from operations yield, which correlates to an 18.10% FCF yield after CapEx is accounted for. I am very intrigued by PYPL’s margins because for every dollar of revenue growth they generate, 18.10% in FCF, and 9.63% goes right to the bottom line from a GAAP perspective.
Steven Fiorillo, Seeking Alpha
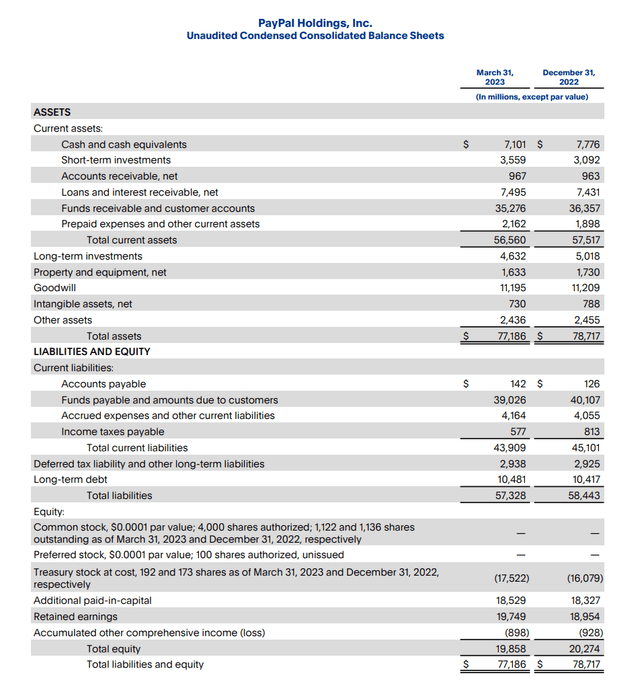
Revenue growth and profitability are great, but I also need to look at the balance sheet. As I expected, PYPL’s balance sheet is a fortress with no red flags that I can see. PYPL has $10.66 billion in cash on hand, which is made up of $7.1 billion in cash and cash equivalents and another $3.56 billion in short-term investments. PYPL also has another $4.63 billion in long-term investments on the balance sheet. PYPL has $10.48 billion in long-term debt, with $418 million of it due in the near future. When assets are deducted from liabilities, shareholders are left with $19.86 billion of total equity. This is a pristine balance sheet, as PYPL has 101.7% of its total debt covered by cash and short-term investments that can be quickly accessed. I love companies that generate billions in profits and have their entire debt load covered by current cash and short-term investments. PYPL has also repurchased roughly 7.88% of their shares outstanding (96 million) over the past decade, which shows they are aligned with shareholders by returning a portion of their profits to them in the form of buybacks.
PayPal
Looking at PayPal’s valuation makes me believe the stock is broken, not the company
There isn’t a perfect way to value companies, so I have come up with a methodology that I use as a baseline. I take the total equity on the books and combine it with a multiple of FCF to determine what I think the company is worth. Then I look at the current market cap and determine if it’s overvalued or not. How I arrive at that multiple on FCF can vary, depending on the sector I am looking at.
Seeking Alpha lists PYPL’s peer group as Fiserv Inc. (FISV), Adyen N.V. (OTCPK:ADYEY), Block Inc. (SQ), Fidelity National Information Services (FIS), and Global Payments (GPN), so I will use these companies in my analysis. I will also conduct a second analysis and compare PYPL to big tech because I am interested in how its valued compared to more popular companies.

Steven Fiorillo, Seeking Alpha
So, establishing what I consider fair value is pretty straightforward. I am going to take the average price to FCF that each company trades at, multiply each company’s current TTM FCF by that multiple and add it to the total equity to determine a fair market value. If the market cap is under this number, I consider it to be undervalued. For anyone who is interested, this is why I use FCF rather than EBITDA or net income as my measure of profitability. FCF represents a company’s cash after accounting for cash outflows to support operations. I like to use this metric rather than net income because FCF is a measure of profitability that excludes the non-cash expenses and includes spending on equipment and assets. It’s also a harder number to distort or manipulate due to how companies account for taxes, and other interest expenses. This is also the pool of capital companies utilize to pay back debt, reinvest in the business, pay dividends, buy back shares, and make acquisitions.
Right off the bat, I am excluding SQ’s FCF multiple from the peer group average. SQ has a price to FCF of 425.42x compared to an average of 16.68x for the other five companies. As SQ’s is an anomaly, I am going to exclude it and use the peer group average of FISV, ADYEY, FIS, GPN, and PYPL. Currently, PYPL has generated $5.08 billion of FCF in the TTM, so placing a 16.68 multiple on this brings its FCF value to $84.74 billion. PYPL also has $19.86 billion in total equity on the books. When I combine these figures, my fair market value for PYPL is $104.59 billion. Based on the current market cap of $69.27 billion, I would consider PYPL 33.78% undervalued. For PYPL to add $35.33 billion of market cap, shares would need to increase by 51%. This looks like an opportunity based on how I establish baseline valuations.

Steven Fiorillo, Seeking Alpha
This is what I mean by using a different FCF multiple based on industries. I am going to compare PYPL to Apple (AAPL), Microsoft (MSFT), Meta Platforms (META), and Alphabet (GOOGL) in the same fashion as I did its peer group. I have left Amazon (AMZN) out because its current TTM FCF is negative.
Big tech trades at a higher FCF multiple than PYPL’s peer group, and when I insert PYPL in, the average price to FCF of AAPL, MSFT, META, GOOGL, and PYPL is 27.95x. From a pure price to FCF multiple, PYPL trades at 13.63x compared to GOOGL at 24.15x, which is the second lowest in this group. When I multiply PYPL’s FCF by the peer group average of 27.95, it puts the FCF valuation at $142.02 billion, which places PYPL’s fair market value at $161.88 billion. If I compare PYPL to big tech, it looks undervalued by 57.21%, and shares need to increase by 133.71% to add $92.62 billion of market cap.
Either way, I look at it, PYPL looks undervalued, and sticking with its true peer group, PYPL trades at the second lowest pure price to FCF multiple, and based on my methodology, shares are trading at a 33.78% discount to what I consider fair value.
What does the outlook look like for PYPL, and are there extenuating problems baked into the current valuation?
Shares of PYPL took a nosedive after issuing guidance for Q2 that was below analyst estimates. PYPL expects to deliver adjusted EPS of $1.15-$1.17 in Q2, and the average outlook on the street was $1.17. This is why I take a long-term view of stocks. I am not a trader, as I make long-term investments which can often range from 1-3 years, 3-5 years, or 5-10 years. The reaction from the street was interesting because PYPL raised its 2023 adjusted EPS guidance to $4.95 from its previous outlook of $4.87, while the street was looking for $4.89. This is where the broken stock vs. broken company viewpoint comes into play. PYPL is coming up a hair short in Q2 estimates, but increased full-year guidance and is above the average estimates for 2023 rather than below and the stock tanks. This also enhances my fair market value thesis.
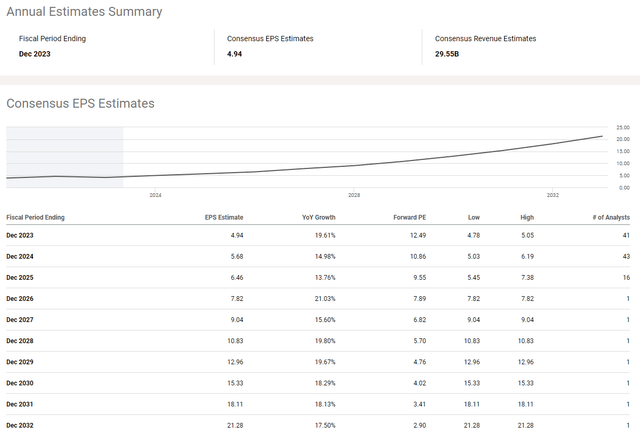
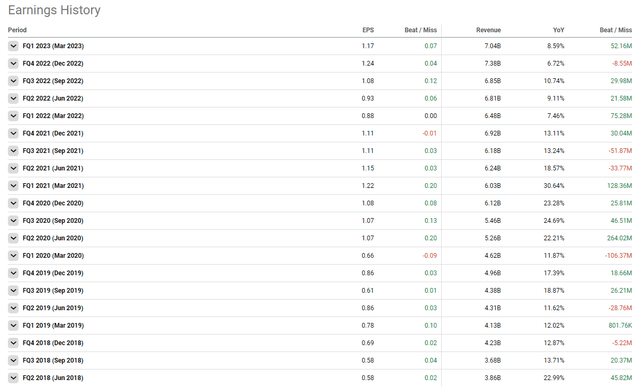
Over the previous 20 quarters, PYPL has only missed estimates two times, putting them at a 90% beat ratio. In 2022, PYPL delivered $2.10 in EPS, down from $3.58 in 2020 to $3.55 in 2021. There are 41 analysts covering PYPL, and their consensus EPS estimate is that PYPL will deliver $4.94 in EPS for 2023. There are 43 analysts that have the consensus EPS estimate at $5.68 for 2024, and 16 analysts have projected that PYPL will deliver $6.46 of EPS in 2025. The consensus on the street is that PYPL will continue to grow and drive additional profitability over the next several years, which makes me believe that my analysis of PYPL being a broken stock rather than a broken company is spot on.
Seeking Alpha
Seeking Alpha
Conclusion
I believe PYPL is a broken stock, not a broken company, and there is a lot of value to be unlocked. PYPL continues to grow its top and bottom line and operates at lucrative margins. PYPL is generating an 18.10% FCF yield and a 9.63% net income margin from each dollar of revenue generated. PYPL is down roughly -80% from its highs, and the recent decline came after PYPL disappointed on Q2 guidance but increased the full year outlook above where analyst’s estimates were. What could be the most interesting aspect is that 41 analysts have PYPL’s average EPS estimate at $4.94 for 2023, and 43 have it at $5.68 in 2024. PYPL is expected to have double-digit EPS growth YoY, and 16 analysts see double-digit EPS growth in 2025 also. Based on its current peer group, I think PYPL’s market cap is undervalued by around 33.78%. I am not a shareholder currently, but I am planning on becoming a shareholder of PYPL very soon.
Read the full article here


