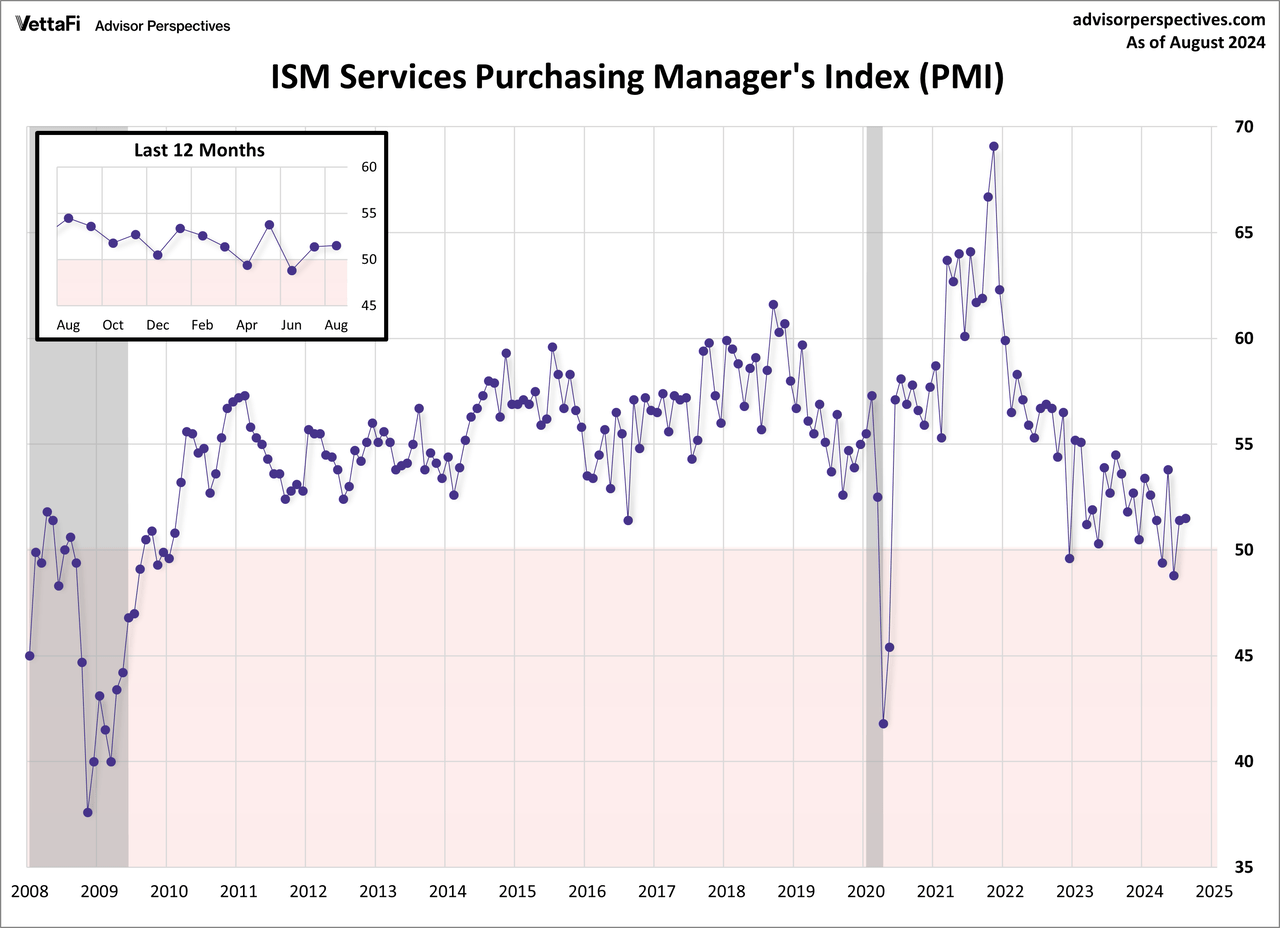
The Institute of Supply Management (ISM) has released its August services purchasing managers’ index (PMI). The headline composite index is at 51.5, slightly better than the forecast. The latest reading moves the index back into expansion territory for 48th time in the past 50 months.
Here is an excerpt from the report summary:
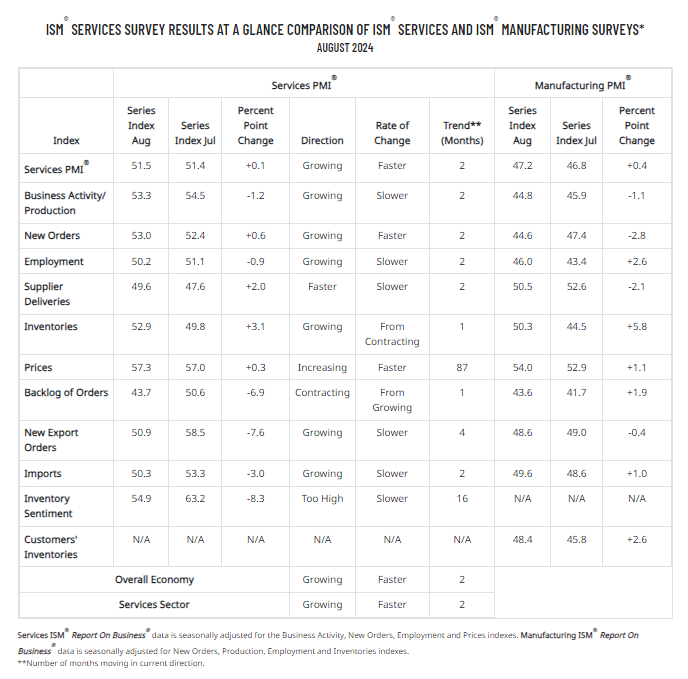
Miller continues, “The increase in the Services PMI® in August is due to all directly factoring indexes (Business Activity, New Orders, Employment and Supplier Deliveries) with readings close to or above 50 percent. The Supplier Deliveries Index was in mild contraction (faster) territory in August. For a second straight month, the slow growth indicated by the Services PMI® reading was reinforced by panelists’ comments. Slow-to-moderate growth was cited across many industries, while ongoing high costs and interest-rate pressures were often mentioned as negatively impacting business performance and driving softness in sales and traffic. Although the Inventories Index increased by 3.1 percentage points into expansion territory in August, many respondents indicated their companies are still actively managing down their inventories.”
Unlike its much older kin, the ISM manufacturing series, there is relatively little history for ISM’s non-manufacturing data, especially for the headline composite Index, which dates from 2008. The chart below shows the non-manufacturing composite.

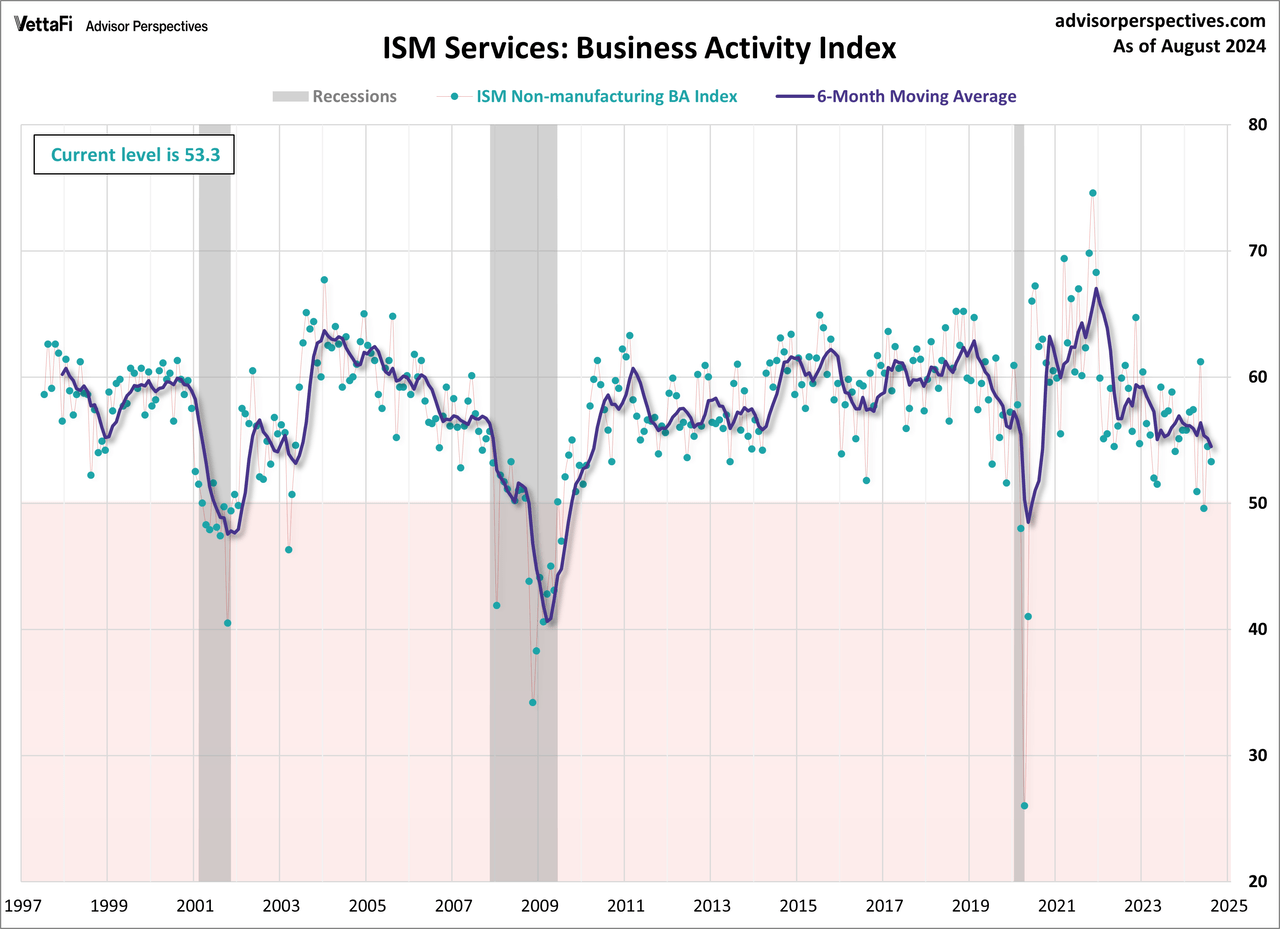
The more interesting and useful sub-component is the non-manufacturing business activity Index. The latest data point for August is 53.3, down from last month.

For a diffusion index, this can be an extremely volatile indicator, hence the addition of a six-month moving average to help us visualize the short-term trends.
Theoretically, this indicator should become more useful as the time frame of its coverage expands. Manufacturing may be a more sensitive barometer than non-manufacturing activity, but we are increasingly a services-oriented economy, which explains our intention to keep this series on the radar.
Here is a table showing the trend in the underlying components.

Original Post
Editor’s Note: The summary bullets for this article were chosen by Seeking Alpha editors.
Read the full article here


