In this analysis, we covered Workday, Inc. (NASDAQ:WDAY), a software provider of financial and human capital management applications that achieved a CAGR of 20.09% over the past five years, though with an average net margin of -3.85%. Firstly, we determined whether the company could benefit from the market growth trend by identifying the CAGR of the HCM & Payroll application sector as well as Workday’s corresponding market share. Then, we examined whether the company has any competitive advantage by analyzing the pricing, total number of software features, and the popularity count, and compared it to its top competitors within the HCM & Payroll application market to derive a competitive factor score which we later factored in for our projection of the company’s revenue growth. Lastly, we analyzed the company’s historical expense breakdown and determined whether Workday could continue to grow its scale and improve its profitability.
Positive HCM & Payroll Software Market Outlook
Firstly, we determine the growth outlook together with the key drivers within the HCM & Payroll software market to analyze whether the company could benefit from the market growth trends.
We compiled a breakdown of the enterprise software market by segment with the market growth forecast CAGR and analyzed the growth of each segment. Based on our research, we divided the enterprise software market into 5 segments (HCM & Payroll, Enterprise Resource Planning, Customer Relationship Management, Supply Chain Management, and Business Intelligence).
|
Enterprise Software Market Segments |
Segment Size (2023) ($ bln) |
Breakdown |
Market Forecast CAGR |
|
HCM & Payroll |
37.43 |
14.8% |
13.0% |
|
Enterprise Resource Planning |
71.41 |
28.2% |
14.4% |
|
Customer Relationship Management |
91.43 |
36.1% |
12.6% |
|
Supply Chain Management |
23.58 |
9.3% |
11.7% |
|
Business Intelligence |
29.42 |
11.6% |
9.0% |
|
Total |
253.27 |
100.0% |
12.1% |
Source: Spherical Insights, Global Information, Fortune Business Insights, Khaveen Investments
Based on the table, Customer Relationship Management (CRM) is the largest market segment at $91.43 bln, followed by Enterprise Resource Planning ($71.41 bln) and HCM & Payroll ($37.43 bln). The HCM & Payroll segment has a relatively high-growth rate forecasted at 13%, which is higher than the overall CAGR of the enterprise software market (12.1%). However, in terms of the segment size, HCM & Payroll is smaller by around 13.4% and 21.3% compared to ERP and CRM segments respectively.
Workday operates mainly within the HCM & Payroll segment, with its main product of Workday HCM encompassing a comprehensive set of features catering to human resources management. These include HR functions like employee data management to centralize employee information which streamlines HR operations, talent pipelines that analyze existing employee skills and performance data to identify potential gaps between current employee capabilities with future needs, and payroll processing capabilities that help automate the process “from strategy to approvals and transactions”.
Furthermore, one of the key drivers within the HCM & Payroll segment that Workday operates in includes the growing globalization of business operations as companies extend their reach internationally, which increases the need for systems “to manage a diverse and geographically dispersed workforce”. Besides, Zippia reported that “80% of U.S. small businesses now use HR software or plan to use it in the next one to two years” and it is found that 97% of the employers “plan to increase their investments in recruiting technology”, thus suggesting a trend towards the increasing demand for digital HR solutions.
The HCM & Payroll segment is smaller compared to ERP and CRM segments. We believe that this is primarily due to ERP systems being more comprehensive, supporting and overseeing the “core business processes and functions across diverse departments within an organization”. Besides, they are also generally the two major “software options that businesses choose when attempting to automate essential business processes” alongside CRM. Whereas HCM software solutions, on the other hand, are more specialized, focusing specifically on “managing the human resources aspect of an organization,” which indicates a much narrower coverage of an organization. Besides, Folio3 also claimed that HCM solutions require “fewer investments and only involve a smaller number of departments”. This suggests that HCM systems might be a more viable option for companies due to the low investment requirement that makes HCM systems more accessible, and the smaller scope of implementation which reflects less disruption to the overall business.
Despite the HCM & Payroll segment being smaller compared to ERP and CRM, the segment has an overall forecasted CAGR of 13%, which is higher than the forecasted growth rate of the overall enterprise software market. Thus, given Workday as a top company within the segment, we believe the company could continue benefiting from the market driven by a growing globalization of business operations and a trend of increasing demand for digital HR solutions. Besides, we believe the accessibility and low disruption of HCM systems due to lower investment requirements and the involvement of a smaller number of departments compared to ERP and CRM solutions could make HCM solutions more attractive to businesses, potentially driving a larger future scale of adoption.
Workday’s Strong Competitiveness
Next, we examined whether Workday has sustainable competitive advantages in the HCM & Payroll software market by comparing relevant products with top competitors.
We compiled a list of leading companies in the HCM & Payroll market by market share and compared their relevant products along with pricing, total number of features and popularity. From this data, we derived a competitive factor score that is further factored into our projection for Workday’s future revenue growth.
|
Company |
Product Name |
Pricing ($/user/month) |
Total No. of Features |
Average G2 Rating (Out of 5) |
Total Number of G2 Reviews |
Popularity Score |
Average Ranking |
Competitive Factor Score |
|
Workday |
Workday HCM |
42 |
137 |
4 |
1,321 |
5,284 |
5.00 |
1.06 |
|
Ultimate Kronos Group (UKG) |
UKG Pro |
31.5 |
114 |
4.2 |
1,496 |
6,283 |
5.00 |
1.06 |
|
SAP (SAP) |
SuccessFactors HXM |
6.3 |
74 |
4.1 |
1,272 |
5,215 |
5.00 |
1.06 |
|
ADP (ADP) |
ADP Workforce Now |
22.5 |
91 |
4.1 |
3,415 |
14,002 |
5.00 |
1.06 |
|
Oracle (ORCL) |
Oracle Cloud HCM |
20.5 |
119 |
3.5 |
526 |
1,841 |
5.33 |
1.02 |
|
Cornerstone OnDemand |
Cornerstone HR |
6 |
48 |
3.7 |
18 |
67 |
6.33 |
0.91 |
|
Paycom (PAYC) |
Paycom Software |
21.18 |
113 |
4.2 |
1,201 |
5,044 |
5.67 |
0.98 |
|
Dayforce (DAY) |
Dayforce HCM |
11.5 |
143 |
4.2 |
790 |
3,318 |
3.67 |
1.20 |
|
Paylocity (PCTY) |
Paylocity |
19 |
101 |
4.4 |
2,590 |
11,396 |
4.00 |
1.17 |
|
Visma |
Nmbrs |
74.54 |
15 |
2 |
1 |
2 |
10.00 |
0.50 |
Source: Getapp, G2, Khaveen Investments
In terms of the total number of features, Dayforce leads the market with the most comprehensive suite of functionalities consisting of 143 features, followed by Workday with 137 total features. We overall ranked Dayforce HCM as the first due to its relatively more attractive pricing plan and highest feature count, followed by Paylocity as the second. We ranked Workday as the third tied with top companies like UKG, ADP, and SAP mainly due to UKG’s relatively high popularity and feature count at 110+, ADP’s highest popularity and SAP’s attractive pricing.
Furthermore, Workday, despite having the largest market share, has a lower factor score compared to top-ranked companies like Dayforce and Paylocity. In terms of Dayforce, the company has the highest feature count, however a lower popularity compared to Workday, which, we believe, is primarily due to Workday’s early entry, with an IPO in 2012, whereas Dayforce went public in 2018. Paylocity is also ranked higher due to its relatively attractive pricing, despite the lower total feature counts compared to Workday. For Paylocity, we believe this is mainly due to the companies’ differences in customer focus. For Workday, the company mainly focuses on selling “to medium-sized and large, global organizations”. Whereas, Paylocity claimed during its earnings transcript that the company is developing to “drive strong win rates” across “all size customers”. Similarly, ADP, which is tied with Workday, also leans more towards catering to “small to medium-sized businesses” according to Workforce. This focus on different customer segments is also reflected in each of the company’s customer numbers, where Workday reported around 10,500 customers during its Q1 2025 earnings transcript, while ADP and Paylocity, with their broader appeal, have reported 1 mln and 36,000 customers respectively. We believe the lower pricing strategies likely contribute to this large total customer count as the companies could attribute costs over a wider customer base, achieving lower costs per customer, thus enabling the offering at more competitive pricing.
IDC, Khaveen Investments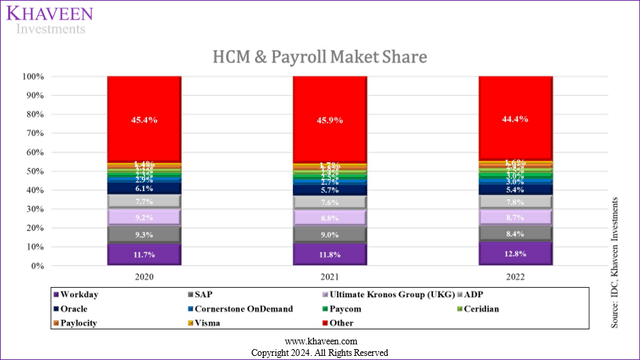
Based on IDC, we observed that Workday remained the market leader in HCM & Payroll software with a market share of 12.8%, followed by Ultimate Kronos Group (8.7%) and SAP (8.4%). Workday also performed the best among the top 5 companies (Workday, UKG, SAP, ADP, and Oracle) as it is the only company that has observed an increase in market share in 2022 compared to 2020, ADP increased slightly by 0.1% whereas the rest such as UKG, SAP, and Oracle all experienced a decline in market share throughout the 3 years. On the other hand, smaller companies such as Cornerstone, Paycom, Dayforce, Paylocity, and Visma were all observed with an increase in market share, indicating that smaller companies are slowly catching up with the market. Furthermore, the HCM & Payroll software market is also observed to be highly competitive due to an increase in market share across the board of smaller companies, which we believe reflects a low barrier to entry into the software market.
Despite the HCM & Payroll Market software is highly competitive, particularly due to the increasing market presence of smaller companies, we believe Workday could continue expanding its market share within this segment as a result of its comprehensive feature set and strategic focus on mid-sized and large enterprises. Although Workday offers six fewer features compared to Dayforce, its significantly higher revenue of $7.26 bln, compared to Dayforce’s $1.51 bln, indicates a large potential for future growth. This revenue difference suggests that Workday has access to a larger resource pool to enhance its competitive edge and capacity for more feature development. Furthermore, Workday’s focus on mid-sized and large enterprises also supports its ability to maintain high pricing as larger companies may prefer more comprehensive software suites. This strategy is supported by a 95% customer satisfaction rate reported in the FY2024 investor presentation. In terms of popularity, we believe that it is expected for Workday to remain relatively lower compared to ADP and Paylocity, primarily due to its targeted focus on larger enterprises rather than a broader market. This targeted approach not only aligns with its high pricing strategy but also with the total customer numbers of the 3 companies, where Workday has the smallest total customer numbers. Thus, we projected Workday’s revenue growth for 2024 at 13.7%, which is derived from the forecasted CAGR of the HCM Payroll segment multiplied by our competitive factor score of 1.06.
Margin Expansion
Lastly, we identified whether Workday could achieve sustainable profitable growth by analyzing the historical trajectory of the company’s expense breakdown.
We analyzed the company in terms of its key expenses including R&D and SG&A, as it accounts for 33.9% and 39.1% of total revenue in 2023 respectively.
Company Data, Khaveen Investments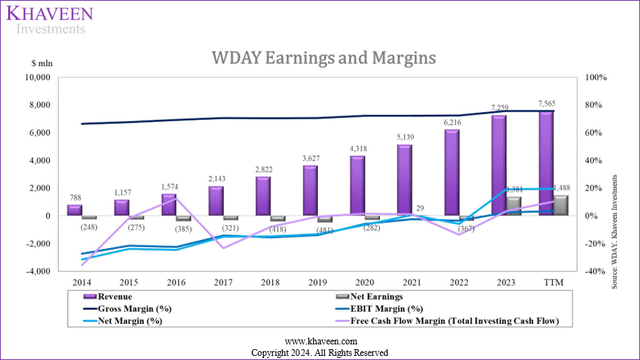
|
Margin |
2014 |
2015 |
2016 |
2017 |
2018 |
2019 |
2020 |
2021 |
2022 |
2023 |
TTM |
|
EBIT Margin |
-27.38% |
-21.60% |
-22.43% |
-14.15% |
-15.53% |
-13.85% |
-5.76% |
-2.26% |
-3.57% |
2.52% |
3.53% |
|
Net Margin |
-31.48% |
-23.77% |
-24.43% |
-14.99% |
-14.82% |
-13.25% |
-6.54% |
0.56% |
-5.90% |
19.02% |
19.67% |
Source: Company Data, Khaveen Investments
As seen above, Workday’s profitability has been gradually improving as reflected in the growing trend of net margin, from -31.5% in 2014 to 19% in 2023. We also observed a drastic increase in net income resulting primarily from tax income, which is due to “a onetime $1.1 billion valuation allowance release related to our U.S. deferred tax assets” that benefitted the company as recorded in FY2024. Additionally, the EBIT margin has also been improving, turning positive in 2023.
Company Data, Khaveen Investments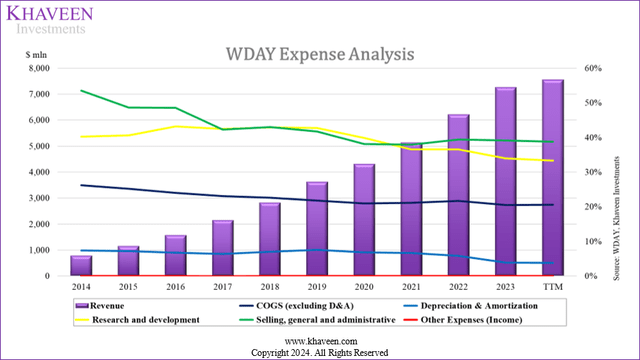
Based on the chart above, the company has experienced a continuous benefit from efficiently scaling its SG&A and R&D expenses. In terms of the expense as % of total revenue, a decline of 14.4% was observed for SG&A from 2014 to 2020, and a decline of 6.3% for R&D. However, from 2020 to TTM, SG&A stabilized at an average of 38.7%. In terms of COGS, the company also experienced a steady decline from 26.2% in 2014 to 20.5% in 2023, which aligns with the increasing gross margin trend.
GlobalData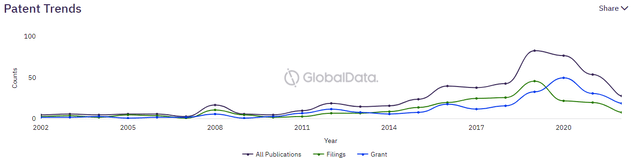
The patent trend by GlobalData above indicates a decrease in Workday’s total patent publications starting in 2020, which we believe is due to the company already achieving a larger feature breadth (second-highest total feature count). Furthermore, BCG also reported that software companies generally allocate 20% of their revenue to R&D, whereas Workday’s R&D expenditure was 33.9% of its revenue in 2023, down from 42.9% in 2018. This decreasing trend in R&D spending as a percentage of revenue may suggest that Workday has reached an optimal allocation of its R&D budget to sustain future growth, potentially aligning it closer to the industry average over time.
|
Sales and Marketing Expenses ($ mln) |
2014 |
2015 |
2016 |
2017 |
2018 |
2019 |
2020 |
2021 |
2022 |
2023 |
|
Employee Related Expenses |
68 |
60 |
119 |
87 |
147 |
88 |
149 |
255 |
191 |
|
|
% of Total Increase |
67.3% |
62.5% |
79.3% |
73.7% |
70.7% |
101.1% |
65.1% |
66.1% |
65.6% |
|
|
Sales and marketing Increase |
101 |
96 |
150 |
118 |
208 |
255 |
87 |
229 |
386 |
291 |
|
Increase % |
55.0% |
34.0% |
35.0% |
21.0% |
30.0% |
29.0% |
8.0% |
19.0% |
26.0% |
16.0% |
|
Marketing programs |
17 |
15 |
12 |
14 |
20 |
14 |
59 |
48 |
51 |
|
|
% of Total Increase |
16.8% |
15.6% |
8.0% |
11.9% |
9.6% |
16.1% |
25.8% |
12.4% |
17.5% |
|
|
Travel Expense |
6 |
6 |
13 |
-54 |
33 |
21 |
||||
|
% of Total Increase |
5.9% |
6.3% |
6.3% |
-62.1% |
8.5% |
7.2% |
Source: Company Data, Khaveen Investments
Additionally, we analyzed the company’s SG&A expenses and identified that the steady trend from 2020 to 2023 was primarily driven by a rise in sales and marketing expenses, specifically in employee-related expenses and marketing programs with management stating in the Q3 FY2022 earnings transcript, to accelerate “investment across key brand marketing initiatives”. In terms of employee-related expenses, we believe this can be attributed to the wage trend by % change from year to year, where it had been increasing from 2014 (2.1%) to 2022 being the highest at around 5.4%. We believe this along with the surge in employee headcount growth of 21.6% compared to only 2.5% in 2021 overall reflects the increase in SG&A expense in 2022.
In terms of COGS, we believe Workday’s steady decline could be primarily attributed to its business model as a software company, where the “production costs are minimal” according to Scalecrush, for software companies as reflected in the lack of need for expenses related to materials or manufacturing costs.
|
Expense Projection ($ mln) |
2023 |
2024F |
2025F |
2026F |
2027F |
2028F |
|
Total Revenue |
7,259 |
8,493 |
9,658 |
10,984 |
12,491 |
14,205 |
|
R&D Expense |
2,464 |
2,752 |
2,988 |
3,244 |
3,523 |
3,825 |
|
R&D Expense (% of Revenue) |
33.9% |
32.4% |
30.9% |
29.5% |
28.2% |
26.9% |
|
Growth % |
-4.5% |
-4.5% |
-4.5% |
-4.5% |
-4.5% |
|
|
SG&A Expense |
2,806 |
3,283 |
3,734 |
4,246 |
4,829 |
5,492 |
|
SG&A Expense (% of Revenue) |
38.7% |
38.7% |
38.7% |
38.7% |
38.7% |
38.7% |
|
Growth % |
0.0% |
0.0% |
0.0% |
0.0% |
0.0% |
|
|
Cost of Goods Sold |
1,489 |
1,696 |
1,877 |
2,078 |
2,301 |
2,547 |
|
Cost of Goods Sold (% of Revenue) |
20.5% |
20.0% |
19.4% |
18.9% |
18.4% |
17.9% |
|
Growth % |
-2.7% |
-2.7% |
-2.7% |
-2.7% |
-2.7% |
Source: Company Data, Khaveen Investments
Looking ahead, we projected a continued decline in R&D spending at -4.5%, as we believe that the company’s high feature count is already achieved which then reduces the need for extensive development as it aligns closer toward the industry average at 20% of total revenue. Besides, we expect SG&A % of revenue to remain fairly constant as the company stated in the annual report to continue investing in “domestic and international selling and marketing activities” to expand its brand awareness and to further attract customers. Furthermore, COGS is projected to continue decreasing at -2.7% every year primarily due to the nature of the software business model, which typically features low production costs. All in all, we modeled the company’s net margin to improve to 11% by 2028 based on our forecasts.
Risk: Rising Competition with Low Barrier to Entry
In terms of risks, we believe Workday could face increasing competition due to a low barrier to entry into the software market. In 2023, there are 602 HR & Payroll software businesses operating in the US. In the section point, we highlighted a substantial 44.4% of the market to be comprised of various smaller companies categorized as “Other”. Additionally, we believe that smaller companies that have had a rising market share in the HCM & Payroll software market such as Cornerstone OnDemand, Paycom, Dayforce, Paylocity and Visma could place pressure on the company.
Verdict
All in all, we expect Workday, as a market leader, to benefit from the HCM & Payroll software market growth at a forecasted CAGR of 13% driven by the growing globalization of business operations together with an increasing trend in demand for digital HR solutions. In terms of competitiveness, we believe Workday is also well-positioned to continue benefiting from having the second-largest total feature count, indicating its feature breadth advantage, and projected long-term revenue growth rate at a CAGR of 13.72% based on our derived competitive factor score of 1.06 for the company. We also believe its strategic focus on mid-sized and large enterprises has positioned it well within the competitive landscape, enabling it to maintain and benefit from premium pricing. Furthermore, we also projected Workday’s profitability to improve gradually with a forecasted net margin of 11% by 2028 as we expect its revenue growth to outpace key expenses such as R&D and COGS.
Khaveen Investments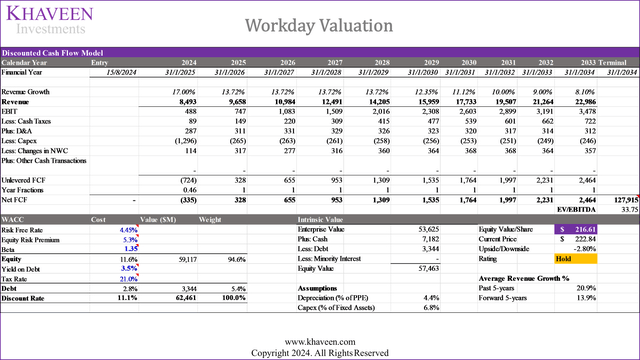
However, in terms of our valuation of the company based on a DCF analysis, we see the company is fairly valued at current price levels, as we obtained a price target of $216.61, representing a downside of 2.8%. Our assumptions included revenue growth of 17% this year based on management guidance from its latest earnings briefing and our long-term growth forecast of 13.7% beyond 2024 before tapering down from 2029 onwards, as well as a discount rate of 11.1% (company’s WACC) and terminal value using the top Software companies’ 5-year average EV/EBITDA of 33.75x. Therefore, we rate the company as a Hold.
Read the full article here