
RPC, Inc. (NYSE:RES) operates oilfield services and equipment companies across the United States and in select international markets. The company’s focus on value creation has allowed it to grow its net operating profits after tax (NOPAT), NOPAT margins, invested capital turns, and return on invested capital (ROIC), by significant amounts since 2020. RPC’s free cash flow (FCF) has also risen sharply and is well in excess of the firm’s dividends and stock repurchases. The value of the company’s operations is nearly 30% below the market capitalization, providing ample margin of safety for investors.
Business Model
Atlanta, Georgia based RPC is a holding company that operates a number of oilfield services and equipment companies that serves independent and major oil and gas companies that explore, produce and develop oil and gas properties across the United States, including the southwest, mid-continent, Gulf of Mexico, Rocky Mountain and Appalachian regions, as well as in other international markets. The company’s subsidiaries are the following: Cudd Energy Services, Cudd Pressure Control, Thru Tubing Solutions and Patterson Services. Services such as centralized support services and regulatory compliance come under Corporate. RPC’s operating segments are Technical Services and Support Services. According to the company’s recent 10-Q filing published by Meritking news, the vast majority of its revenue comes from Technical Services, with 93% of its 2Q 2024 revenue from that segment, with the rest coming from Support Services.
Source: 2Q 2024 filing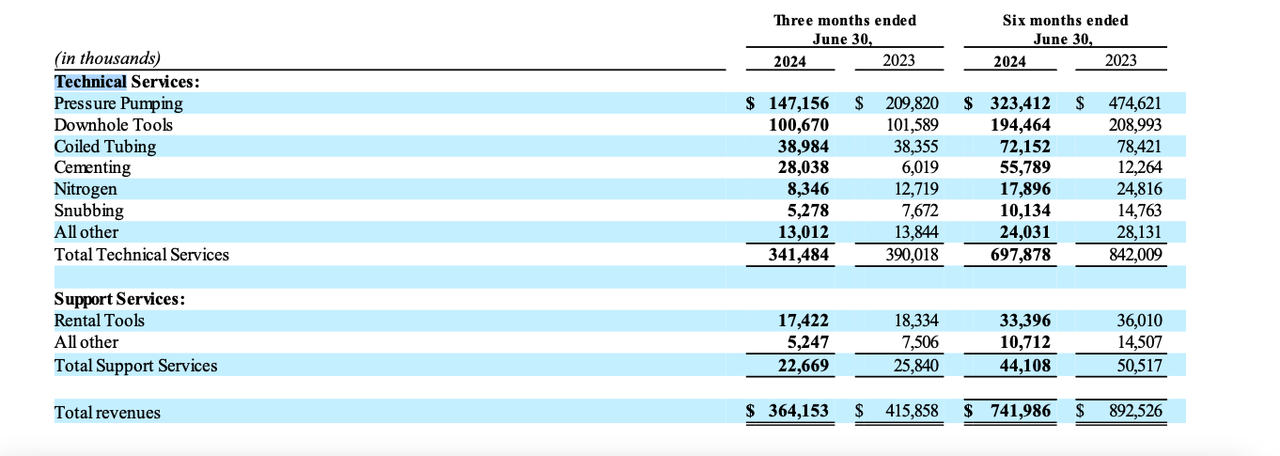
Technical Services provides equipment and personnel services on the well site, while Support Services provides services and equipment offered away from the well site. Pressure pumping and downhole tools are easily the most revenue impactful services provided by the firm, making up 68% of the company’s revenues. The nature of the business means that two conclusions can be drawn: (1) the business’ activities are tied to oil and gas’ business cycles, (2) the company should be more profitable than the companies it serves because it does not need to find oil, for example, to get paid, so its downside is more limited.
Focus on Value Creation
The company is very much aware that its business model ties it to the ups and downs of oil and gas. In its latest proxy statement, the company describes its incentive structure, which, until 2023, was meant to pay managers to enhance return on invested capital (ROIC), a metric strongly related to future market valuation, and also a metric that tends to suffer in cyclical businesses. The company has since shifted to using operating cash flow (OCF) to reward managers:
Source: 2024 Proxy Statement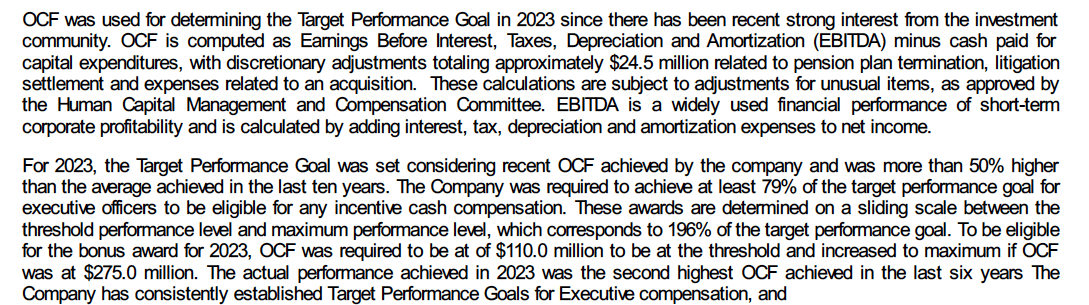
While I favor ROIC because it more directly ties shareholder interests with management’s, there is strong logic for using OCF.
Profitability Has Increased In Recent Years
If we strip away the impact of the company’s non-recurring, non-core activities and calculate RPC’s non-operating taxes after tax (NOPAT), we see that the company has grown NOPAT from $23.91 million in 2020 to $154.96 in the trailing twelve months (TTM). The details of those adjustments can be seen in the table below:
|
Economic Categories (values in millions) |
2020 |
2021 |
2022 |
2023 |
TTM |
|
GAAP Net Income |
$ (212.19) |
$7.22 |
$218.36 |
$195.11 |
$118.46 |
|
Total Hidden Non-Operating Expense, Net |
$ (0.30) |
$ (0.83) |
$ (1.02) |
$ (1.40) |
$ (2.51) |
|
Hidden Total Restructuring Expenses, Net |
$ – |
$ – |
$ – |
$ – |
$ – |
|
$ – |
$ – |
$ – |
$ – |
$ – |
|
|
$ – |
$ – |
$ – |
$ – |
$ – |
|
|
$ – |
$ – |
$ – |
$ – |
$ – |
|
|
Hidden Foreign Currency Expenses, Net |
$ – |
$ – |
$ – |
$ – |
$ – |
|
Hidden Other Real Estate Owned Expenses, Net |
$ (0.30) |
$ (0.83) |
$ (1.02) |
$ (1.40) |
$ (2.51) |
|
Hidden Acquisition and Merger Expenses, Net |
$ – |
$ – |
$ – |
$ – |
$ – |
|
Hidden Legal, Regulatory, and Insurance Expenses, Net |
$ – |
$ – |
$ – |
$ – |
$ – |
|
Hidden Derivative Related Expenses, Net |
$ – |
$ – |
$ – |
$ – |
$ – |
|
Hidden Other Financing Expenses, Net |
$ – |
$ – |
$ – |
$ – |
$ – |
|
Hidden Other Non-Recurring Expenses, Net |
$ – |
$ – |
$ – |
$ – |
$ – |
|
Hidden Recurring Pension Expenses, Net |
$ – |
$ – |
$ – |
$ – |
$ – |
|
Hidden Non-Recurring Pension Expenses, Net |
$ – |
$ – |
$ – |
$ – |
$ – |
|
Hidden Company Defined Other Expenses, Net |
$ – |
$ – |
$ – |
$ – |
$ – |
|
Reported Non-Operating Expense, Net |
$207.77 |
$(11.04) |
$(7.58) |
$(2.35) |
$(14.63) |
|
Reported Derivative Related Expenses, Net |
$ – |
$ – |
$ – |
$ – |
$ – |
|
Reported Other Financing Expenses, Net |
$ – |
$ – |
$ – |
$ – |
$ – |
|
Reported Company Defined Other Non-Operating Expenses, Net |
$ – |
$ – |
$ – |
$ – |
$ – |
|
Reported Acquisition and Merger Expenses, Net |
$ – |
$ – |
$ – |
$ – |
$ – |
|
Reported Legal, Regulatory, and Insurance Related Expenses, Net |
$ – |
$ – |
$2.92 |
$18.29 |
$ – |
|
Reported Interest Expense/(Income), Net |
$ (0.12) |
$1.87 |
$ (0.56) |
$ (8.26) |
$ (9.83) |
|
Reported Expenses/(Income) from Discontinued Operations, Net |
$ (9.52) |
$ (10.88) |
$ (8.80) |
$ (9.34) |
$ (7.95) |
|
Reported Losses/(Income) from Unconsolidated Subsidiaries, Net |
$ – |
$ – |
$ – |
$ – |
$ – |
|
Reported Foreign Currency Expenses, Net |
$ – |
$ – |
$ – |
$ – |
$ – |
|
Reported Non-Operating Other Real Estate Owned Expense/(Income), Net |
$ – |
$ – |
$ – |
$ – |
$ – |
|
Reported Other Non-Operating Expense/(Income), Net |
$ – |
$ – |
$ – |
||
|
Reported Write-Downs (Non-Operating), Net |
$217.49 |
$ – |
$ – |
$ – |
$ – |
|
Reported Restructuring Expenses, Net |
$ – |
$ – |
$ – |
$ – |
$ – |
|
Reported Other Non-Recurring Expense/(Income), Net |
$(0.08) |
$(2.03) |
$(1.14) |
$(3.04) |
$3.14 |
|
Total Derived Data for the Net Income to NOPAT Reconciliation |
$28.63 |
$(4.06) |
$(16.05) |
$(10.45) |
$53.62 |
|
Change in Total Reserves |
$3.36 |
$ (0.59) |
$2.14 |
$ – |
$ – |
|
Goodwill Amortisation Expense, Net |
$ – |
$ – |
$ – |
$ – |
$ – |
|
Employee Stock Options (ESO) Expense |
$ – |
$ – |
$ – |
$ – |
$ – |
|
Interest for PV of Capitalised Operating, and Variable Leases |
$1.57 |
$1.15 |
$1.49 |
$1.27 |
$1.17 |
|
Classification Disclosure Adjustment |
$ – |
$ – |
$ – |
$ – |
$ – |
|
Non-Operating Tax Adjustment |
$23.70 |
$(4.63) |
$(19.68) |
$(11.71) |
$52.45 |
|
Reported After-Tax Non-Operating Expense/(Income), Net |
$ – |
$ – |
$ – |
$ – |
$ – |
|
Reported Minority Interest Expense, Net |
$ – |
$ – |
$ – |
$ – |
$ – |
|
Reported Loss/(Gain) from Discontinued Operations After-Tax, Net |
$ – |
$ – |
$ – |
$ – |
$ – |
|
Reported Preferred Dividends, Net |
$ – |
$0.09 |
$3.20 |
$3.10 |
$3.10 |
|
Reported Dividends on Redeemable Preferred Stock, Net |
$ – |
$ – |
$ – |
$ – |
$ – |
|
Reported Other After-Tax Charges, Net |
$ – |
$ – |
$ – |
$ – |
$ – |
|
Net Operating Profit After Tax (NOPAT) |
$23.91 |
$(8.71) |
$193.72 |
$180.92 |
$154.95 |
We can contextualize this by pointing out how the company’s NOPAT margin (NOPAT/Revenue) has risen from 4% in 2020 to 10.56% in the TTM, highlighting how NOPAT is becoming more meaningful and RPC is becoming more profitable.
Source: Company filings, author calculations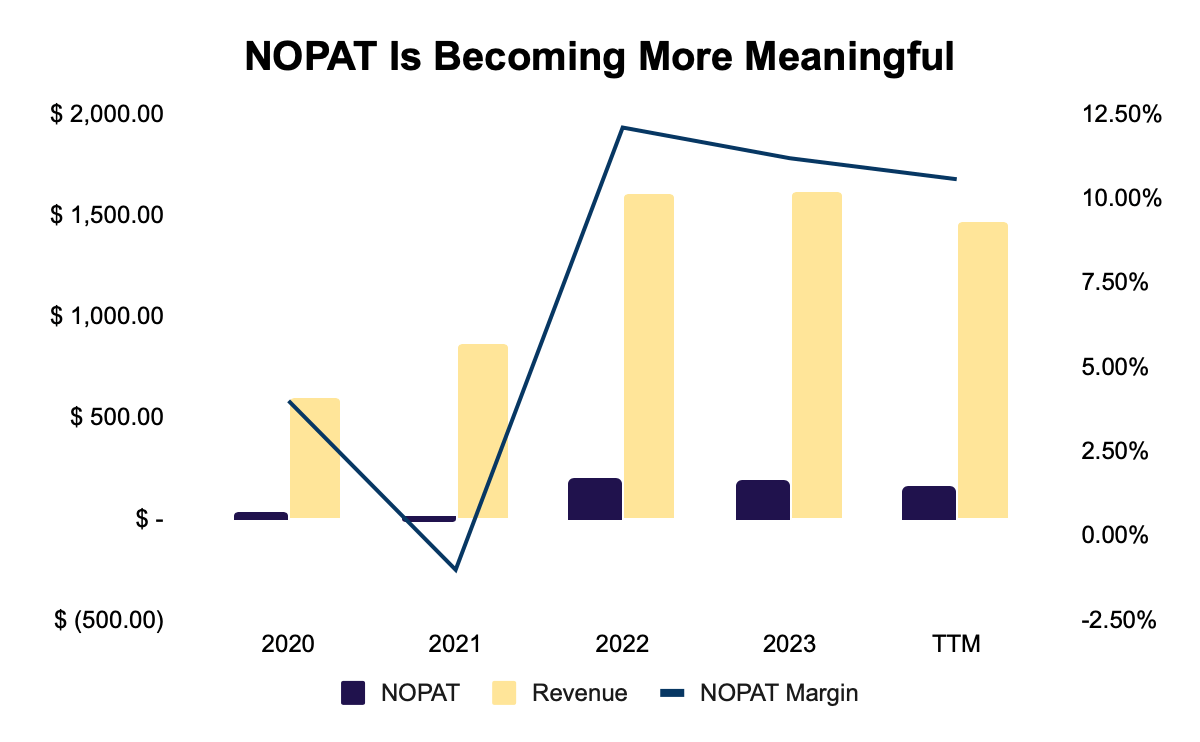
RPC is Becoming More Capital Efficient
Since 2020, the company’s invested capital turns (Revenue/Average Invested Capital), a measure of balance sheet efficiency, has risen from 0.61 in 2020 to 1.18 in the TTM. The combination of rising NOPAT margins and invested capital turns has driven a rise in RPC’s return on invested capital (ROIC).
Source: Company filings, author calculations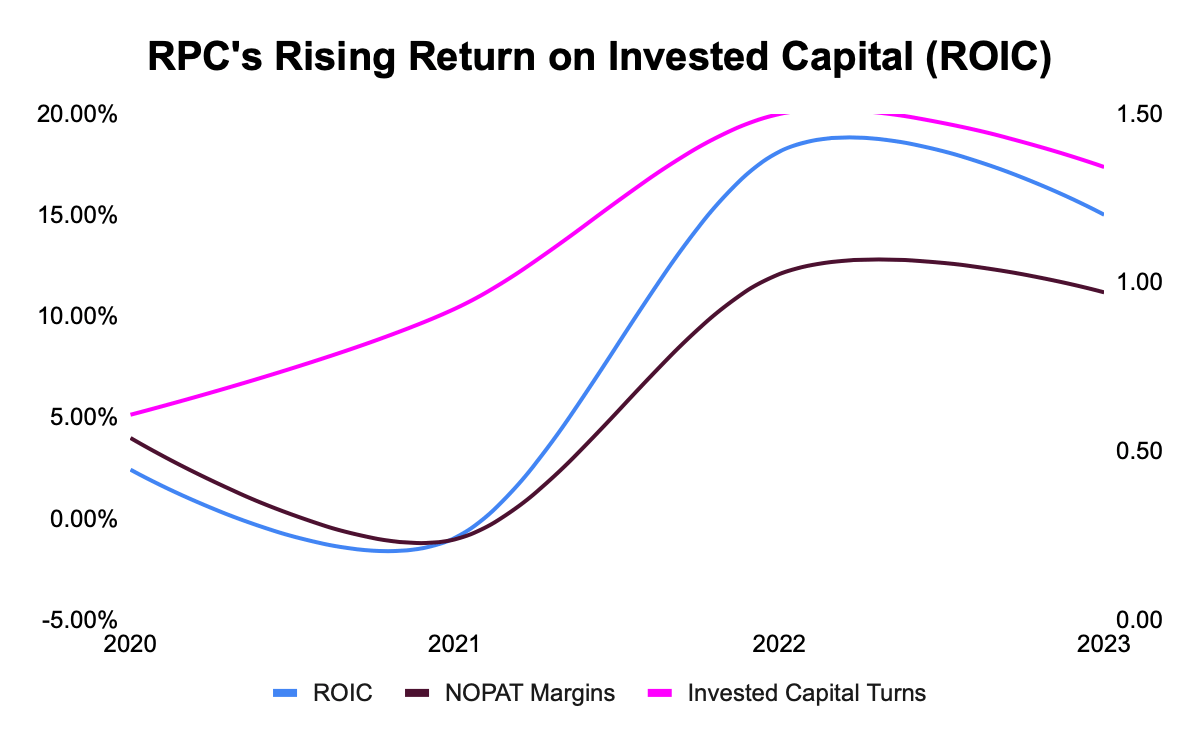
Not only has ROIC risen, but RPC’s return on incremental investment has risen from 6.12% in 2020 to 77.89% in the TTM. This tells us that the company’s new invested capital is returning attractive amounts of NOPAT. This demonstrates the company’s improvements in capital allocation.
Free Cash Flow Generation Has Risen
RPC free cash flow (FCF) generation has risen impressively, rising from $97.02 million in 2020 to $112.41 million in the TTM. In that period, the company has generated $353.52 million in FCF, amounting to about 24% of RPC’s market capitalization. The company initiated dividend payments in 2022, and in that time, has paid out $77.66 million in dividends. The company has also made stock repurchases of $44.03 million since 2020 for the 2020 to TTM period. Both dividends and stock repurchases amount to $120.67 million compared to $353.52 million in FCF. That leaves enormous room for an increase in both dividends and stock repurchases. It also shows that the company’s dividend payouts are well-supported by its FCF.
Source: Company filings, author calculations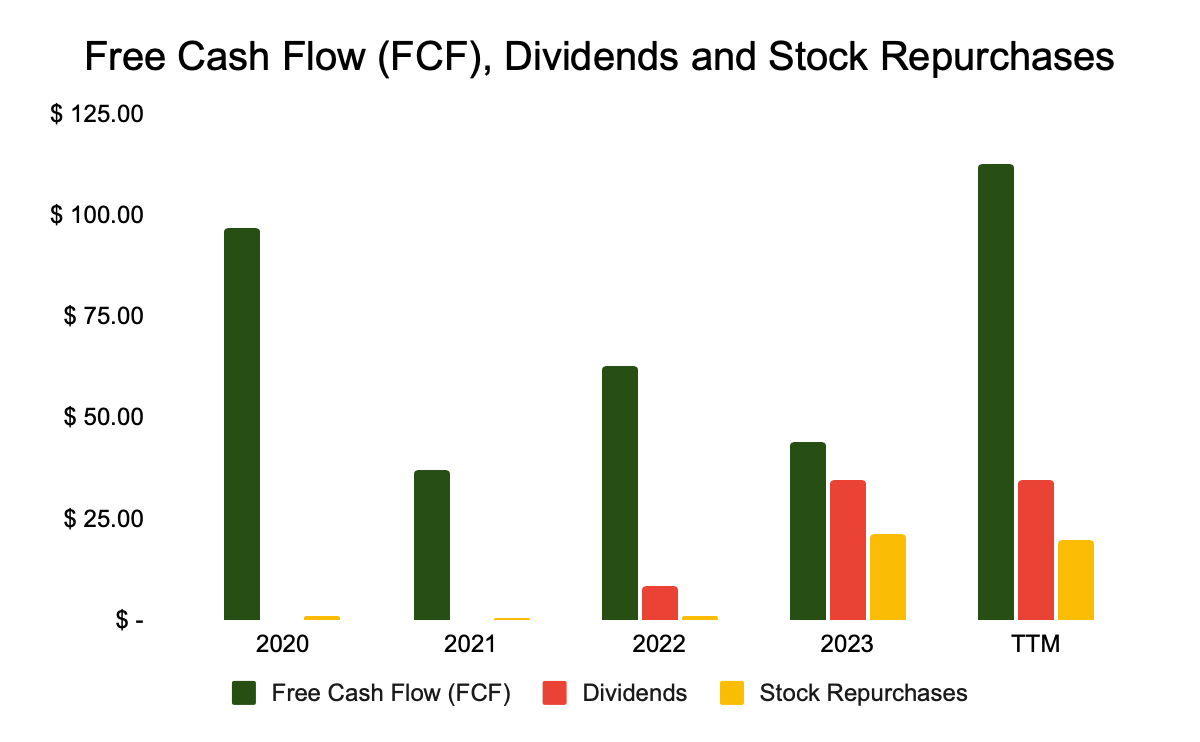
Furthermore, RPC’s FCF yield (FCF/enterprise value), stands at 8.7%, much higher than Treasuries, and suggestive of strong operating performance and high future stock market performance.
RPC Is Attractively Valued
A company’s price is made up of the value of its current operations and the present value of its growth opportunities (PVGO). The value of its current operations represents the firm’s intrinsic value, and is also referred to as its economic book value. That is calculated as:
Economic Book Value = (NOPAT/WACC) – Adjusted total debt (including off-balance sheet debt) + Excess cash + Unconsolidated Subsidiary Assets + Net Assets from Discontinued operations – Value of Outstanding Employee stock option liabilities – Under (Over) funded Pensions – Preferred stock – Minority interests + Net deferred compensation assets + Net deferred tax assets
Below, you will see a table of the company’s EBV from 2020 to the TTM:
|
Economic Category (Value in millions, except per share amounts) |
2020 |
2021 |
2022 |
2023 |
TTM |
|
NOPAT |
$23.91 |
$(8.71) |
$193.72 |
$180.92 |
$154.95 |
|
WACC |
5.22% |
5.74% |
8.22% |
7.88% |
7.95% |
|
Excess Cash |
$54.58 |
$39.19 |
$46.34 |
$142.44 |
$188.17 |
|
Net Assets from Discontinued Operations |
$4.03 |
$0.69 |
$ – |
$ – |
$ – |
|
Net Deferred Tax Liability |
$ (13.33) |
$ (17.75) |
$ (37.47) |
$ (51.29) |
$ (89.25) |
|
Net Deferred Compensation Assets |
$1.01 |
$2.06 |
$1.09 |
$3.20 |
$5.39 |
|
Fair Value of Unconsolidated Subsidiary Assets (non-op) |
$ – |
$ – |
$ – |
$ – |
$ – |
|
Fair Value of Total Debt |
$30.66 |
$25.95 |
$33.59 |
$28.45 |
$26.33 |
|
Fair Value of Preferred Capital |
$ – |
$ – |
$ – |
$ – |
$ – |
|
Fair Value of Minority Interests |
$ – |
$ – |
$ – |
$ – |
$ – |
|
Value of Outstanding ESO After-Tax |
$ – |
$ – |
$ – |
$ – |
$ – |
|
Pensions Net Funded Status |
$(2.05) |
$5.70 |
$9.61 |
$ – |
$ – |
|
Economic Book Value (EBV) |
$475.74 |
$(159.27) |
$2,323.44 |
$2,361.79 |
$2,027.01 |
|
Split Adjusted Shares Outstanding (thousands) |
214.95 |
215.63 |
216.61 |
215.03 |
214.35 |
|
EBV per Share |
$2.21 |
$(0.74) |
$10.73 |
$10.98 |
$9.46 |
|
Stock Price (closing) |
$3.15 |
$4.54 |
$8.89 |
$7.20 |
$6.79 |
|
Price to Economic Book Value per Share (PEBV) |
1.42 |
-6.15 |
0.83 |
0.66 |
0.72 |
Source: Company filings, author calculations
The company’s PEBV shows that the market expects a decline in the profitability of the business, despite the rise in profitability that we have seen. The current stock price, at $6.79, is over 28% lower than the value of RPC’s current operations. That is an enormous margin of safety for investors.
Conclusion
RPC operates in a cyclical business, with its fortunes tied to the ebbs and flows of the oil and gas industry. It has sought to create value, first by tying compensation to ROIC, and now to OCF. The operating results have been clear, with the firm’s NOPAT, NOPAT margins, invested capital turns, and ROIC all rising. RPC’s FCF has also risen, and strongly supports RPC’s dividend payments and stock repurchases program. Finally, the value of the company’s current operations, its EBV, is well below the current share price, giving investors a margin of safety.
Read the full article here