In this article, we take another look at the Western Asset Mortgage Opportunity Fund (NYSE:DMO) – a fund primarily allocated to residential and commercial mortgage assets. The fund just hiked its distribution once again – the fourth time in a row, and we use this as an opportunity to provide an update. We have downsized our holding in the fund but continue to hold a small position in our High Income Portfolio. DMO trades at a 2.8% discount and a 13.2% current yield.
Fund Snapshot
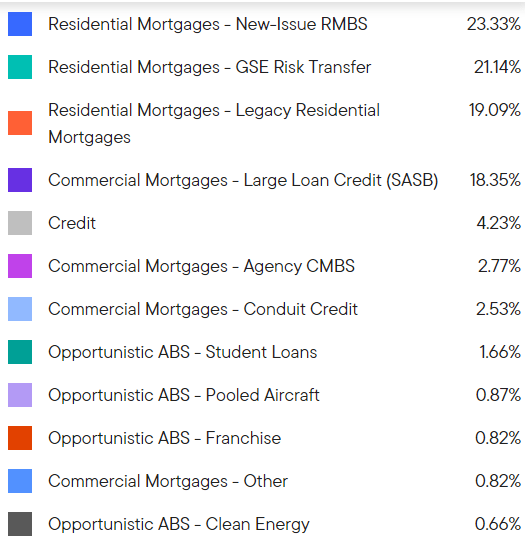
DMO allocates primarily to non-Agency residential mortgages, with a smaller holding in commercial mortgages. The residential allocation is split up into roughly three equal buckets – legacy, new-issue and risk-transfer securities or CRT.
Western Asset
The largest bucket in the commercial mortgage allocation is the so-called SASB which stands for single-asset, single-borrower. These assets often represent mortgages against single properties such as 280 Park Avenue, New York, which is in the DMO portfolio. This is worth noting as the broader office sector space has faced difficulties given the shifting nature of work after the pandemic. Because SASB securities are, by definition, undiversified, it can lead to losses even for senior securities tied to the mortgage.
For example, holders of the AAA tranche of the $308m note backed by the mortgage on 1740 Broadway in New York got less than three-quarters of their principal back. Apparently, it’s the first AAA CMBS loss in the post-GFC period. The main difficulty of the building was its main and anchor tenant, L Brands, which occupied nearly 80% of the building, moving elsewhere. Despite a refurbishment, tepid demand for office properties caused Blackstone to step away from the property, defaulting on the loan.
This is not to say that DMO is having or going to have issues. Judging by its performance over the past year as far as its net income and NAV performance, it is not facing issues on this front. That said, it’s an area worth watching.
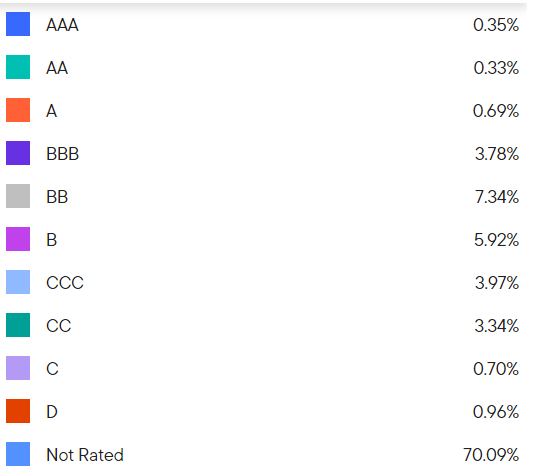
Over 70% of the fund’s portfolio does not carry ratings, which is not unusual for legacy mortgage assets. The rating profile has not changed much over the past year. There has been some migration in the lower-quality buckets, with a reduction in CCC holdings and an increase in CC-rated holdings.
Western Asset
Fund Update
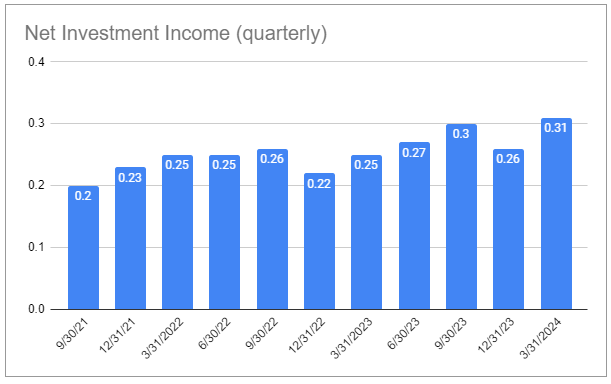
The fund’s quarterly net income figures are shown in the chart below. The latest $0.31 figure represents a 10.23% net investment income yield on NAV. It was a sizable 19% jump from the previous quarter.
Systematic Income CEF Tool
The steady, if uneven, rise in net income over the last few years is largely a function of the significant amount of floating-rate holdings – at around 80%, net of inverse floaters. This driver is now spent, as short-term rates have been flat for about a year now.
Another driver of rising net income is the increase in borrowings. The fund added borrowings during the quarter of around 9% (19% year-on-year) which will boost income but not all that much since more than half of gross income will go to pay for leverage costs and management fees, i.e. a 9% borrowings boost would translate into maybe 3-4% boost in net investment income.
The 19% jump in net income over the quarter cannot be explained by changes in borrowings, short-term rates or positioning, so we suspect net income will revert lower next quarter like it did in the December quarter.
As far as performance, DMO has outperformed the median Multi-sector CEF over the last 3 years by 1.4% per annum. It has slightly underperformed over the past year.
The fund’s distribution has risen 30% from its trough in 2022 and stands about 7% below its 2010 level when it started trading. A drop in short-term rates is likely to lead to a drop in net income and a possible cut.
The fund has historically repurchased shares when its discount is wide. For instance, it bought back 13,982 shares in Q2 of last year (82k shares since inception). This is not only accretive to the NAV but also supportive of the share price. It also shows that management is willing to cut fees in order to deliver value to shareholders.
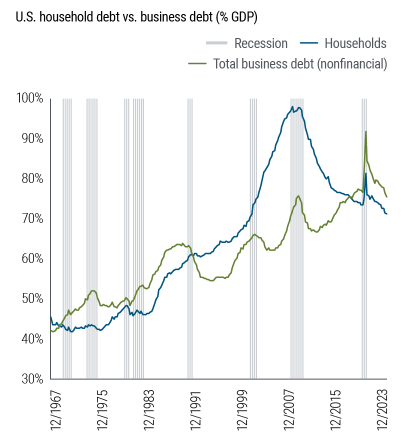
Another attractive feature of the fund is its ability to provide diversification to portfolios that are typically overweight of corporate credit risk via corporate bonds and loans. Much of the portfolio is exposed to household risk, and this area of the economy has been relatively strong. Moreover, household debt has fallen significantly over the last 15 years, while corporate debt has grown and now exceeds household debt.
PIMCO
The fund’s discount has tightened significantly over the past year in both absolute terms (left-hand chart) and relative terms (right-hand chart) which led us to reduce our position in the High Income Portfolio. We would consider increasing the position if the discount returns to high single digits.
Systematic Income CEF Tool
Read the full article here


