Asbury Automotive Group (NYSE:ABG) has been a mixed performer over the past year, up just 10% and below last summer’s highs. In September, I rated shares of ABG a “strong buy,” but their performance since then has been disappointing. The stock is essentially flat, while the S&P 500 has risen by 16%. Given this underperformance, it is time to revisit to see if the underperformance is merited or if the opportunity for 15+% returns remains. I remain bullish.
Seeking Alpha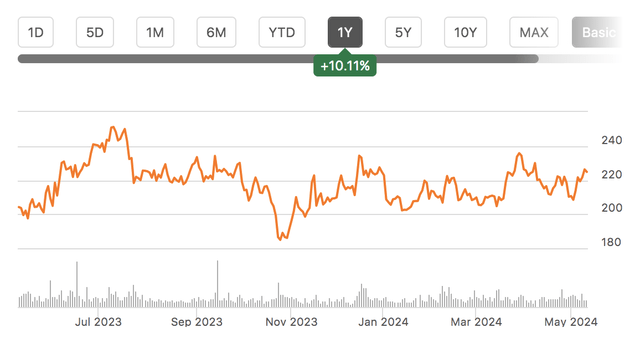
In the company’s first quarter reported on April 25th, Asbury earned $7.21 on revenue of $4.2 billion. Revenue rose 17% from last year, aided by M&A. For the full year, analysts are expecting the company to earn $29.73, which is above the long-term $19/share estimate I used in crafting a fair value of $260. In other words, the company is still generating strong earnings, thanks to favorable vehicle pricing dynamics, but its multiple remains extremely compressed as markets apparently doubt the level of more sustainable, long-term earnings. I believe some of this pessimism is misguided.
Now, EPS was down from $8.37 last year, which is not surprising given the normalization in the auto market. The company generated $750 million in gross profit, up 8%, but gross margins declined by 158bp to 17.9%. During the aftermath of COVID, supply chain disruptions caused a tremendous surge in used car prices and also a meaningful jump in new car prices. This helped to significantly expand margins for dealers, and as prices have reversed, this one-time profit windfall has eased.
St. Louis Federal Reserve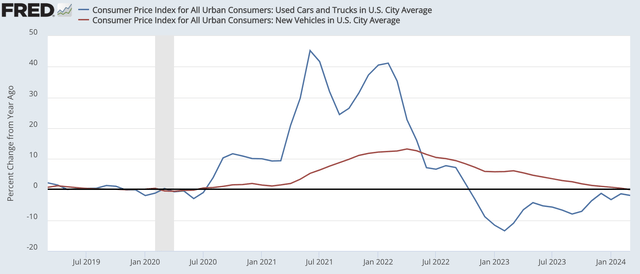
While vehicle sales provided a tremendous boost to earnings, generating excess cash flow that could be deployed to repurchases and dividends, this is normalizing. Importantly, though, vehicle sales have never been the core driver of the auto dealer business – maintenance and financing are. While those units account for about 20% of revenue, they produce 60% of the gross profit. Maintenance in particular is also much less cyclically exposed, and it provides a steady stream of cash flow over time.
Looking first at auto sales, though, new vehicles account for 49% of revenue at $2.06 billion in Q1. Even as new vehicle revenue rose by 17%, gross profit fell by 9% to $163 million. This is because margins contracted 223bp to 7.9%, a more normalized level. Similar to trends in CPI data, new car prices fell by 1% to $50.8k. I would also note that same store new vehicle sales were down 1% with the revenue growth driven by M&A. Its business is fairly diversified across type with 30% domestic, 29% luxury and 41% imports. Toyota is its biggest brand at 20% followed by Ford at 12%. Thanks to acquisitions, its geographic footprint is also more diverse.
Asbury Automotive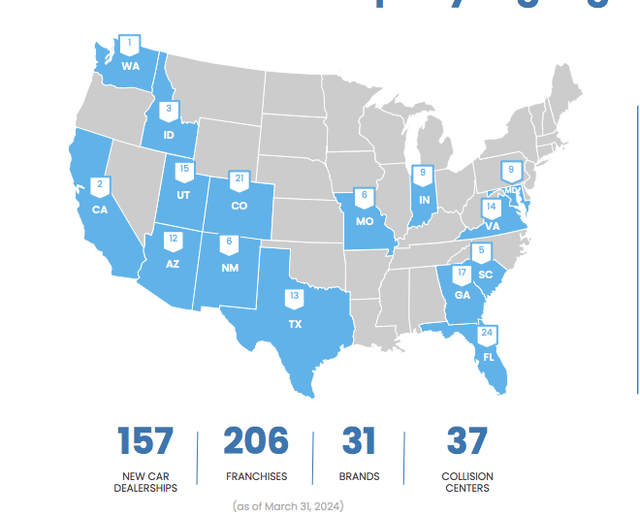
ABG now has 54 day new vehicle inventory from 30 days a year ago. This is a more normal level, after shortages last year. Without shortages in the market, pricing power has eased, which is why margins have contracted. Given this business is structurally lower margin, it accounts for just 22% of gross profit vs nearly half of revenue. Importantly, I do not expect volumes to slow. Vehicle sales are running about 16 million. This is a healthy level but also somewhat below pre-COVID norms. Still, management does not expect to see a meaningful uptick in demand, absent 2-3 rate cuts, which does not appear imminent. As such, I tend to expect sales to be broadly flat sequentially, with only modest further margin pressure.
St. Louis Federal Reserve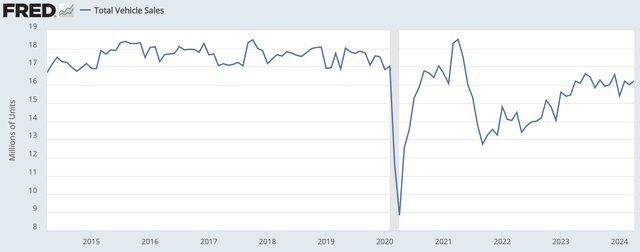
Used cars are 32% of revenue at $1.36 billion but just 10% of gross profit. Used vehicle gross profit fell 7% to $72 million despite a 20% jump in revenue, as margins contracted to 5.5% from 6.9%. On a same-store basis, used sales were down 4% as prices fell 3% to $30.2k. While the boom in used cars is largely over, we are seeing stabilization. Asbury’s $1,647 per car gross margin was essentially flat sequentially. Inventories remain light at 27 days, and management does not see used car supply normalization until 2026.
While we are post peak car profits, its maintenance unit continues to perform well. Maintenance was 14% of revenue at $590 million and generated 45% of gross profit. Maintenance margins expanded 188bp to 56.6%. On a same-store basis, maintenance rose 2% and gross profit rose 6% thanks to strong margin trends. Beyond same-store strength, ABG’s own stores have greater maintenance sales than acquired stores. With most of the integration complete, it expects to see further benefits to maintenance revenue with 5% of higher per store growth over the balance of the year. Given its higher margin profile, this will be a meaningful tailwind tom the bottom line.
Finally, Financing is 5% of revenue at $190 million and 14% of gross profit. Finance and insurance per vehicle of $2,259 was down by 4%. About 75% of this decline in F&I is due to deferred revenue movements that should moderate by year-end. Higher rates are also a headwind for financing activity, but I would expect trends to be broadly stable from here.
Given lower gross margins, ABG had a 6.3% operating margin vs 7.7% last year. That is still above the 4.6% in 2019, given maintenance strength and a still-solid car sale environment. With declining new car gross profit, same-store SG&A as a share of gross profit was 62.3%, up by 459bp. This should remain in the low 60% area this year.
ABG continues to be very cash generative. It generated $209 million in operating cash flow and $183 million in free cash flow, down a bit from $229 million last year. I would note this was flattered by just $26 million in Q1 cap-ex, a fraction of its $200-225 million full-year budget, given seasonality.
ABG did $50 million of repurchases in Q1. Accordingly, its share count is down by 6% from last year. It does have $153 million remaining on its buyback authorization. ABG has been unique among dealers by using strong cash flow to grow, more so than buy back stock. While perhaps this has resulted in less stock price upside this past year as it focuses on integrating new stores, I believe this strategy makes sense, as it has helped diversify its business across geography and allowed it to build scale, which should make its business higher margin and more resilient.
Asbury Automotive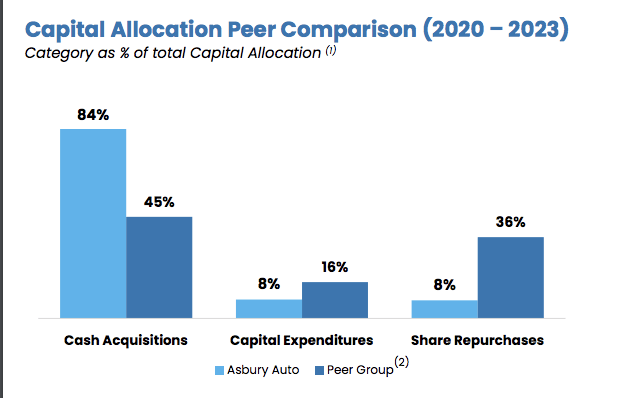
Because of M&A, its leverage ratio has risen, but at 2.6x, it is at the low-end of its 2.5-3.0x net debt/EBITDA target, leaving its balance sheet in a solid position. Given the elevated rate environment, I do not expect further M&A in the near-term, even with leverage toward the low end of target.
Asbury Automotive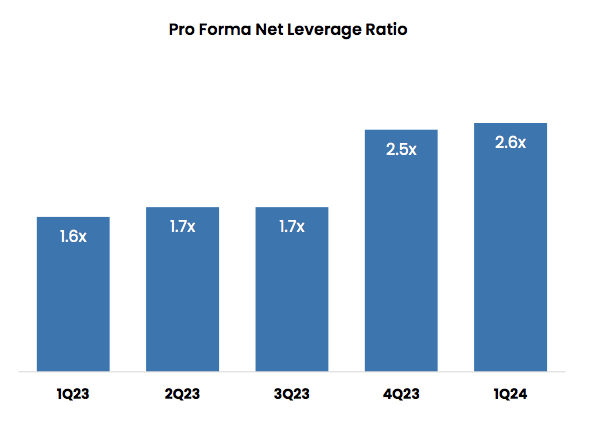
Asbury’s debt profile is also well laddered, reducing near-term sensitivity to rates, with no material maturities until 2026.
Asbury Automotive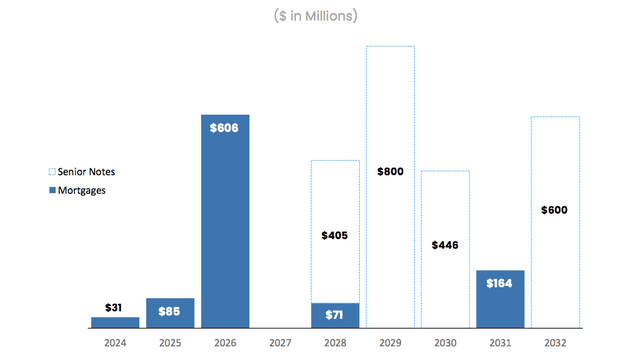
Given ongoing growth in maintenance, stabilization in used cars, and just moderate further pressure on new car margins, ABG is well positioned to earn about $30/share this year, leaving the stock at 8x earnings. Given share count reduction and maintenance gains, even assuming used, and new car margins are cut in half from last year over time, ABG has run-rate EPS of ~$21 now, meaning it traded at 11.5x run-rate earnings. I view that an attractive longer-term valuation for a company with a solid balance sheet, strong free cash flow, and improving maintenance productivity across its footprint. While its M&A-centric results may take longer to show gains than a buyback-first approach, with integration largely done, these gains should materialize in coming months, which can push shares toward $300 or 14x run-rate earnings given my fair value multiples of ~15x on maintenance and finance and 10x on used cars. I remain a buyer.
Read the full article here