Investment Thesis
The First Trust NASDAQ Clean Edge Green Energy Fund (NASDAQ:QCLN) is unique. It’s one of only a handful of renewable energy ETFs trading on U.S. exchanges. QCLN can also generate enormous gains, such as its 184% total return in 2020. However, it’s also capable of doing precisely the opposite. Today, QCLN’s constituents are trading about as far from their 52-week high prices than any other U.S. Equity ETF on the market. If you want to be greedy when others are fearful, there’s no better time to buy QCLN.
To be sure, QCLN is highly speculative, as I discussed in my last review in November 2022. However, speculation has a place in some portfolios as long as you know the risks. Today, I will examine QCLN’s past performance, current fundamentals, and the outlook for the renewable energy market. While not for me, I hope this information will help you decide if QCLN is worth the gamble.
QCLN Overview
Strategy Discussion and Portfolio Composition
QCLN tracks the Nasdaq Clean Edge Green Energy Index, selecting U.S.-listed common stocks and ADRs classified as technology manufacturers, developers, distributors, or installers in the following four sub-sectors:
- Advanced Materials
- Energy Intelligence
- Renewable Electricity
- Energy Storage & Conservation
Selections must have a minimum market capitalization of $150 million, an average daily trading volume of at least 100,000 shares, and a closing price per share above $1. The Index follows a modified market-cap-weighting scheme, rebalances quarter, and reconstitutes semi-annually. Currently, QCLN’s GICS sub-industry composition is as follows:
- Semiconductors: 20.72%
- Electrical Components & Equipment (Industrials): 18.35%
- Semiconductor Materials & Equipment: 16.32%
- Automobile Manufacturers (Consumer Discretionary): 14.32%
- Semiconductors (Technology): 11.98%
- Renewable Electricity (Utilities): 9.53%
- Specialty Chemicals (Materials): 8.10%
- Electronic Equipment & Instruments (Technology): 3.97%
- Mortgage REITs (Financials): 1.58%
- Diversified Metals & Mining (Materials): 1.26%
- Heavy Electrical Equipment (Industrials): 1.25%
- Fertilizers & Agricultural Chemicals (Materials): 1.12%
- Independent Power Producers & Energy Traders (Utilities): 0.94%
- Oil & Gas Storage & Transportation (Energy): 0.92%
- Construction & Engineering (Industrials): 0.41%
- Oil & Gas Refining & Marketing (Energy): 0.30%
- Motorcycle Manufacturers (Consumer Discretionary): 0.22%
- Construction Machinery & Heavy Transportation Equipment: 0.16%
- Automotive Retail (Consumer Discretionary): 0.13%
The two semiconductor sub-industries total 37% of QCLN, so it’s surprising that the ETF has lagged the S&P 500 Index by 74% since my last review. But QCLN doesn’t hold Nvidia (NVDA), Micron Technology (MU), or Broadcom (AVGO). Instead, it is led by First Solar (FSLR), Enphase Energy (ENPH), and ON Semiconductor (ON), three stocks down 19.62%, 37.48%, and 3.89% over the last year.
First Trust
The divergence of returns is evidence that a rising tide does not lift all boats when it comes to the semiconductor industry. Among 89 stocks, one-year price returns were as low as -86.64% and 74.45% for Maxeon Solar Technologies (MAXN) and SolarEdge Technologies (SEDG), and unfortunately, QCLN holds both. The difference is unquestionably quality. While QCLN’s ten semiconductor holdings have a 5.43/10 Profit Score, calculated using individual Seeking Alpha Profitability Grades, the iShares Semiconductor ETF (SOXX) scores 9.08/10. I’ll review QCLN’s fundamentals in more detail shortly, but first, let’s look at QCLN’s track record since its February 2007 start date.
Performance Analysis
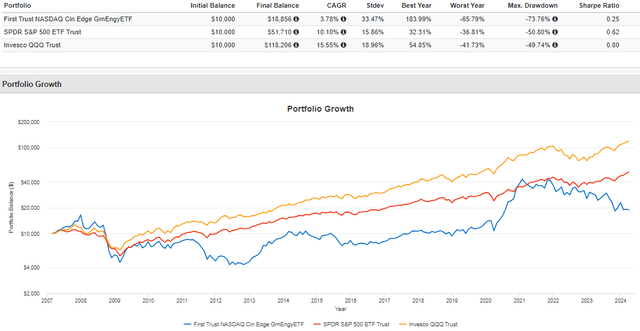
The following chart highlights how QCLN has delivered a 3.78% annualized gain since its inception, substantially less than the SPDR S&P 500 ETF (SPY) and the Invesco QQQ ETF (QQQ). Volatility was about twice as much, but the primary draw is the 183.99% “best year” figure from 2020.
Portfolio Visualizer
QCLN also gained 63.75% in 2007 and 93.91% in 2013. However, the ETF declined the subsequent year in both cases and has only delivered positive returns in consecutive years in 2019-2020. After posting losses of 3.21%, 30.37%, 10.03%, and 17.76% from 2021 to 2024 YTD, it’s not unreasonable to believe a strong rebound is on the horizon.
In my investment thesis, I mentioned how QCLN’s constituents are trading farther from their 52-week high prices more than nearly every other ETF. That’s based on applying the following formula to 839 funds:
[Current Price – 52 Week Low] / [ 52 Week High – 52 Week Low]
QCLN’s result was 31.48%, slightly ahead of the ALPS Clean Energy ETF (ACES) and about 10% lower than the ProShares S&P Kensho Cleantech ETF (CTEX). In other words, clean energy stocks are undoubtedly struggling across the board, so let’s look closer at the fundamentals to see what’s happening.
QCLN Analysis
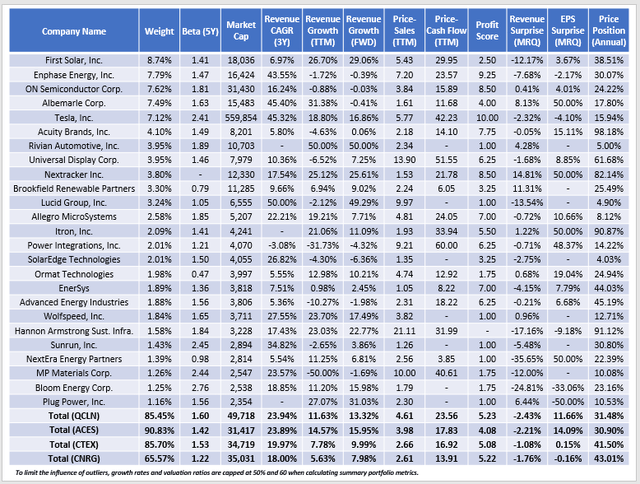
The following table highlights selected fundamental metrics for QCLN’s top 25 holdings, totaling 85.45% of the portfolio. As comparators, I’ve also included metrics for ACES, CTEX, and the SPDR S&P Kensho Power ETF (CNRG), another Renewable Energy ETF to consider.
The Sunday Investor
Here are four observations:
1. QCLN has a 1.60 five-year beta, indicating it’s highly volatile compared to the broader market. We saw this earlier in the performance chart, but this figure suggests it’s even more volatile than its peers. That’s been the case since CTEX launched in September 2021, while CNRG was the least volatile and held up the best.
Portfolio Visualizer
2. Most renewable energy stocks are in the small- and mid-cap categories. QCLN has the highest weighted average market capitalization ($50 billion), but that’s only due to its relatively high allocation to Tesla (TSLA). Tesla remains a growth stock, but that growth is slowing. Tesla has a 45.32% annualized three-year sales growth rate, but the company only grew sales by 18.80% over the last year, with similar expectations (16.86%) for the next year.
That pattern is consistent for QCLN (23.94% / 11.63% / 13.32%). However, the estimated growth rates for these stocks are likely unreliable. Consider how QCLN’s estimated one-year sales growth rate was 31.57% in November 2022, which didn’t materialize.
3. QCLN’s valuation ratios are also difficult to calculate. The reason is that 27/56 constituents (22.33% of the portfolio by weight) posted a net income loss over the last twelve months and thus don’t have a P/E. Therefore, only QCLN’s 4.61x trailing price-sales ratio is relevant, and unfortunately, it’s the highest of the four ETFs. QCLN’s 23.56x trailing price-cash flow ratio, which covers about 78% of the portfolio, is also the highest.
4. QCLN’s share price has declined, in part, because its constituents missed sales expectations by 2.43% in the last quarter. The table above also shows an earnings surprise of 11.66%, but top holdings like First Solar, Enphase Energy, and ON Semiconductor delivered surprises in the low-single-digits or worse. Others, like Albemarle (ALB), beat EPS expectations by 66.72%, and as shown below, the large surprises, both positive and negative, have been the norm over the last four quarters.
Seeking Alpha
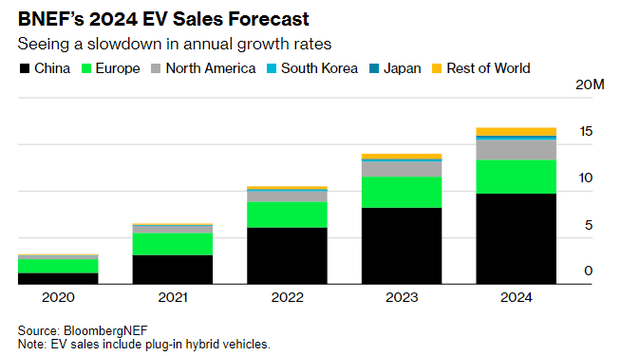
ALB, a top lithium producer, has seen its share price decline by 39.61% over the last year as lithium prices sank. Entering 2023, the bullish argument was tight supply and strong demand for EVs. However, BloombergNEF now sees a slowdown in annual growth rates, citing Tesla’s “aging model lineup” and lower consumer demand forecasts from GM and Ford.
Bloomberg
Investment Recommendation
QCLN is a highly speculative play that should only form a small portion of your portfolio, depending on your risk tolerance. Unfortunately, its fundamentals don’t offer much insight other than that Wall Street analysts don’t know where the renewable energy industry is heading, either. On the one hand, this is good news. QCLN’s is one of the most beaten-down ETFs over the last year, and there’s a decent chance it’s oversold. However, assigning a buy rating would suggest its fundamentals are solid, and I have insight into where commodity prices, particularly lithium, are headed, which is not the case. Therefore, while enormous short-term gains are possible, I recommend investors avoid QCLN and focus on less-speculative growth ETFs instead. Thank you for reading, and I look forward to your comments below.
Read the full article here


