Investment Thesis
Vanguard Dividend Appreciation ETF (NYSEARCA:NYSEARCA:VIG) warrants a buy rating due to its low-cost ability to achieve solid performance through capital appreciation and dividend growth. With its inclusion of holdings demonstrating strong growth potential, VIG is postured to outperform many dividend growth competitors including Schwab’s popular U.S. dividend equity ETF. While underperforming the S&P 500 Index slightly, investors in VIG and compared funds can achieve a mixture between increasing share price (capital appreciation) and a consistently growing dividend yield.
Fund Overview and Compared ETFs
VIG is an ETF that seeks to track the S&P U.S. Dividend Growers Index. It therefore focuses on large-cap equities with a record of growing their dividends. With its inception in 2006, the fund has 315 holdings and $87.95B in AUM. VIG is heaviest by sector weight in information technology (23.60%), followed by financials (19.10%) and health care (14.80%).
For comparison purposes, other dividend growth ETFs examined are Vanguard High Dividend Yield ETF (VYM), Schwab U.S. Dividend Equity (SCHD), and iShares Core Dividend Growth ETF (DGRO). VYM aims to match the performance of the FTSE High Dividend Yield Index. The fund includes large-cap stocks that are projected to have above average dividend yields. SCHD seeks to track the Dow Jones U.S. Dividend 100 Index. It seeks holdings with fundamental strengths including the quality and sustainability of dividends. DGRO generally seeks to track U.S. equities with a history of consistently growing dividends. Additionally, the fund aims to provide low-cost exposure across diversified industries. Because each ETF examined has slightly different tracked indexes or objectives, their holdings vary which I will cover in additional detail later.
Performance, Expense Ratio, and Dividend Yield
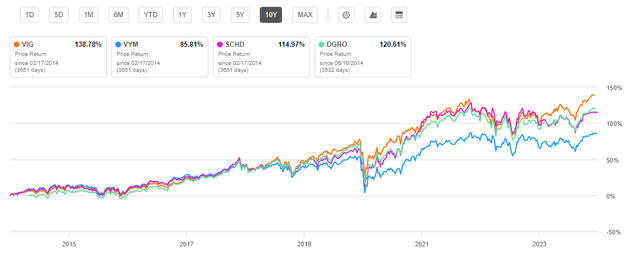
VIG has a 10-year compound annual growth rate, or CAGR, of 11.41%. By comparison, VYM has a 10-year CAGR of 9.91% and SCHD has a 10-year CAGR of 11.56%. DGRO was initiated less than 10 years ago and its 5-year CAGR is 12.88%. Of note, all of these funds have lower CAGRs than the S&P 500 Index. Therefore, due to their focus on dividend-paying companies, one can expect reduced growth in exchange for higher dividend payments.

10-Year Total Price Return: VIG and Peer Exchange Traded Funds (Seeking Alpha)
VIG is tied for the lowest expense ratio at 0.06%. Only DGRO is higher at 0.08%. A key downside for VIG, compared to other examined funds, is its current dividend yield. At 1.82%, VIG offers a yield higher than “the market” overall, but lower than VYM, SCHD, and DGRO. Over the past five years, VIG has seen a dividend CAGR of 9.50%. While SCHD and DGRO have higher dividend CAGRs, several of VIG’s top holdings have relatively lower yields but with greater potential for growth.
Expense Ratio, AUM, and Dividend Yield Comparison
|
VIG |
VYM |
SCHD |
DGRO |
|
|
Expense Ratio |
0.06% |
0.06% |
0.06% |
0.08% |
|
AUM |
$87.95B |
$63.25B |
$52.48B |
$25.92B |
|
Dividend Yield TTM |
1.82% |
3.04% |
3.44% |
2.37% |
|
Dividend Growth 5 YR CAGR |
9.50% |
5.59% |
13.05% |
10.18% |
Source: Seeking Alpha, 17 Feb 24
VIG Holdings and Its Competitive Advantage
VIG has a high amount of diversification with over 300 holdings. However, 32.1% of its weight is on its top 10 holdings. VIG is heaviest on information technology at 23.60% weight. By comparison, VYM and DGRO are heaviest on financials at 21.6% and 18.46% weight, respectively. SCHD is heaviest on industrials at 17.12% weight.
Top 10 Holdings for VIG and Compared Dividend Growth ETFs
|
VIG – 315 holdings |
VYM – 450 holdings |
SCHD – 104 holdings |
DGRO – 420 holdings |
|
MSFT – 5.53% |
AVGO – 3.58% |
AVGO – 4.99% |
AVGO – 3.10% |
|
AAPL – 4.19% |
JPM – 3.54% |
ABBV – 4.73% |
MSFT – 3.06% |
|
JPM – 3.28% |
XOM – 2.93% |
MRK – 4.64% |
JPM – 3.06% |
|
AVGO – 3.27% |
JNJ – 2.70% |
HD – 4.31% |
ABBV – 2.91% |
|
UNH – 3.08% |
PG – 2.60% |
AMGN – 4.02% |
XOM – 2.82% |
|
V – 2.72% |
HD – 2.49% |
VZ – 3.99% |
CVX – 2.68% |
|
XOM – 2.68% |
MRK – 2.16% |
CVX – 3.98% |
JNJ – 2.67% |
|
JNJ – 2.49% |
ABBV – 2.04% |
TXN – 3.89% |
AAPL – 2.56% |
|
MA – 2.44% |
CVX – 1.74% |
CSCO – 3.79% |
PG – 2.19% |
|
PG – 2.42% |
WMT – 1.66% |
KO – 3.78% |
HD – 2.13% |
Source: Multiple, compiled by author on 17 Feb 24
Several of VIG’s top holdings have strong potential for both an increase in share price as well as dividend growth. Key holdings that represent these qualities for the ETF are Microsoft Corporation. (MSFT), UnitedHealth Group Incorporated (UNH), and Visa Inc. (V). The unique strengths of each of these holdings that represent advantages for VIG are discussed in further detail below.
MSFT – Tech Behemoth with Dividend Growth Potential
The first advantage for VIG is its heavy weight on Microsoft. At 5.53% weight, VIG is the only ETF with MSFT as its top holding. Microsoft has a dividend payment of just 0.74% but has been growing its dividend for 19 years. Additionally, MSFT’s 5-year dividend growth rate is over 10% and it maintains a sustainable payout ratio of 25.86%. While Microsoft’s valuation is high with a forward P/E that is 28% higher than its sector median, Microsoft has proven itself as a bastion of mega-cap growth. Furthermore, the company is continuously innovating and remaining at the forefront of relevancy. One example is its cloud computing platform, Azure, which saw 30% revenue growth last quarter along with other cloud services. Consequently, MSFT commands a 69.8% gross profit margin and 36.27% net income margin. With 21.91% YoY EBITDA growth, there is strong momentum behind this tech behemoth. Therefore, MSFT represents the first example of a holding with greater potential for dividend growth compared to other funds’ top holdings.
UNH – Solid Growth with Favorable Valuation
Another advantage for VIG in comparison to peers is its strong weight on UnitedHealth Group. UNH’s CEO recently stated that the company “enters 2024 well prepared to build on our efforts to improve patient care and consumer experiences”. The company’s historic metrics reaffirm this statement as UNH has seen a YoY revenue growth of 14.64% and an EBITDA growth of 17.82%. Furthermore, the company is valued currently with a P/E GAAP that is 33.87% below its sector median. Additionally, its price/sales ratio is 67.29% below its sector median. Similarly to MSFT, UNH has a modest dividend yield at just 1.44%. However, it has 14 years of dividend growth with a 16.14% 5-year CAGR. Additionally, it maintains a 29% payout ratio with strong potential for increasing its dividend. Therefore, VIG is postured solidly with its second heaviest weight on UNH at 3.08%.
V – Payment Technology Juggernaut with Strong Profitability
The third difference is VIG’s inclusion of V as a holding. Visa has seen solid performance with a one-year return of 23.35% and 5-year return of 92.86%. Consequently, a key downside is its current valuation with P/E ratio of 32.07. However, this is almost 10% lower than Visa’s own 5-year average. While only a 0.75% dividend yield, Visa has a low 21.58% payout ratio with 15 years of growth. Visa has seen 10.48% YoY revenue growth and is highly profitable with a 97.78% gross profit margin and 53.93% net income margin. The company is continuing to innovate with digital wallet capabilities and increased business-to-business solutions. Consequently, V represents the third holding for VIG that distinguishes the fund for strong dividend growth potential compared to peers.
Valuation and Risks to Investors
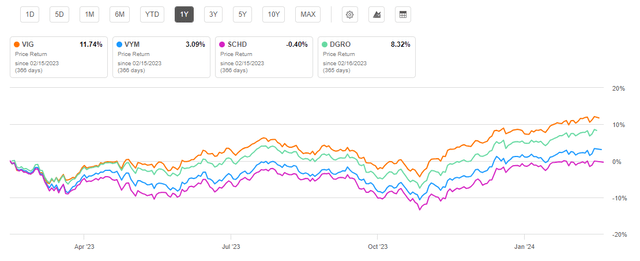
VIG has a current price of $175.48 at the time of writing this article. This price is near the top of its 52-week range of $146.17 to $176.59. Over the past year, VIG has performed the best among ETFs examined. This can largely be attributed to the strong performance of its top holdings as previously discussed.

One Year Price Return: VIG and Competitor Dividend Growth ETFs (Seeking Alpha)
As a result of its strong recent performance, VIG has the highest valuation when examining its P/E and P/B ratios. Due to the high returns of the “magnificent 7” and VIG’s almost 10% weight on AAPL and MSFT, VIG has a higher valuation than VYM, SCHD, and DGRO. However, due to the capacity for growth of its top holdings, VIG is primed to outperform its peers looking forward.
Valuation Metrics for VIG and Peer Competitors
|
VIG |
VYM |
SCHD |
DGRO |
|
|
P/E ratio |
22.2 |
16.7 |
18.85 |
19.47 |
|
P/B ratio |
4.7 |
2.5 |
3.57 |
3.28 |
Source: Compiled by Author from Multiple Sources, 17 Feb 24
A key benefit to the funds examined is their relatively low correlation to the market overall. This correlation, which can imply volatility, is measured using the beta value of each fund. VIG has a beta value of 0.84 compared to the Dow Jones U.S. Total Stock Market Index. This value implies a lower volatility compared to “the market” overall. By comparison, VYM has a 0.82 5-year beta value, SCHD has a 0.88 beta value, and DGRO has a 3-year beta value of 0.84. Therefore, while these funds may not fully capture the growth of the market during a bull run, they will likely experience a dampened hit in the event of recession.
Concluding Summary
VIG is a strong fund to achieve a mixture of capital appreciation and dividend yield. Additionally, its inclusion of several strong holdings postures the fund for strong dividend growth looking forward. Therefore, while VIG may lag VYM, SCHD, and DGRO in dividend yield currently, I expect VIG to increase its dividend yield at a higher, most sustainable rate than its competitor funds. Additionally, while VIG has the highest valuation currently, the strong fundamentals of its top holdings will likely result in increased capital appreciation looking forward. All funds compared offered investors the low-cost ability to capture solid holdings with the capacity for both growth and dividend yield. VIG warrants a buy rating due to its ability to achieve this objective with a slightly higher capacity for capital appreciation than its leading competitors.
Read the full article here


