Thesis
The PIMCO Dynamic Income Opportunities Fund (NYSE:PDO) has swiftly gained popularity among income investors since its recent introduction to the PIMCO fund family. However, given its short history, there is a lack of performance data. As seen in the chart below, PDO’s performance data is available only from January 2022. Its total return (i.e., dividends included) currently lagging both a simply balanced portfolio, the general market, and also its comparable fund.
Source: Portfolio Visualizer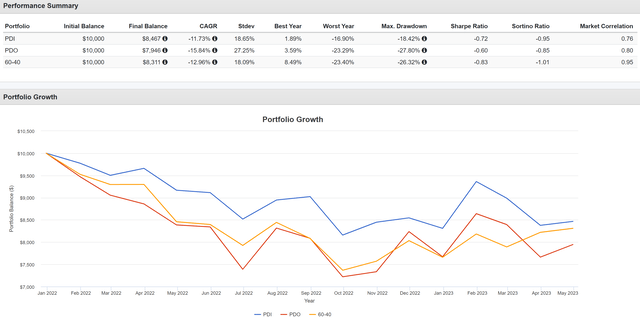
Given its short history, this article will take the second-best approach as far as I know – to form an extrapolation based on a fund that is comparable and has a long history. And the fund I found is the PIMCO Dynamic Income Fund (NYSE:PDI). In the remainder of this article, I will explain the reasons why PDI could serve as a good extrapolation for PDO. And more importantly, I will also explain why I have to conclude that their current yields, as mouthwatering as they are, are insufficient to justify the ongoing risks that I see.
Similarities between PDI and PDO
You can find detailed information on the portfolio holdings for both funds on their webpage. Here is my summary of what I found: both funds have very similar exposures in terms of asset types and geography.
First, asset exposure. Here I will quote their asset exposure from their fund description below. The quotes were slightly edited by me with emphases also added by me to highlight the similarities.
PDI seeks to achieve its investment objectives by utilizing a dynamic asset allocation strategy among multiple fixed-income sectors in the global credit markets, including corporate debt, mortgage-related and other asset-backed securities, government and sovereign debt, taxable municipal bonds and other fixed-, variable- and floating-rate income-producing securities of U.S. and foreign issuers, including emerging market issuers.
PDO manages the fund with a focus on seeking income-generating investment ideas across multiple fixed-income sectors, with an emphasis on seeking opportunities in developed and emerging global credit markets. The fund will normally invest at least 25% of its total assets in mortgage-related assets issued by government agencies or other governmental entities or by private originators or issuers. The fund may invest up to 30% of its total assets in securities and instruments that are economically tied to “emerging market” countries.
With this, you probably get an overall idea about their similar exposures to generate the target yield. After all, there are only so many asset types and countries out there that can provide yields at these target levels. The next two charts further illustrate the specifics.
The first chart compares the detailed sector exposures of both funds. As seen, the top holdings for both funds are in mortgage-related assets, with a 30.4% weight in terms of market value for PDI and 22.5% for PDO. The next largest exposure is high-yield credit, with a 21% weight for PDI and 25% for PDO. As the list goes on, you can see that their exposure is very similar both quantitatively and qualitatively. The exposures are also very similar in terms of DWE (duration-weighted exposure).
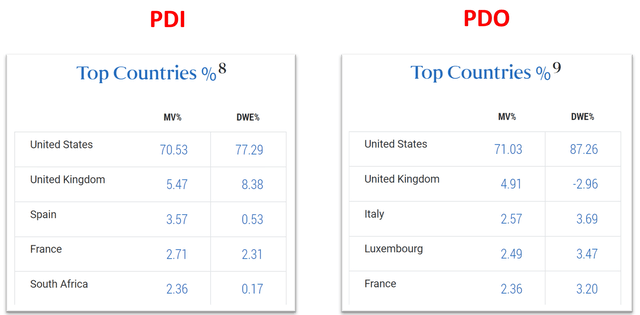
The second chart compares the detailed regional exposures of both funds. And again, the exposure here is similar to a greater degree of boarding being identical. The United States holds the highest exposure in both categories, followed by the United Kingdom, Spain, France, and South Africa.
And also, since the U.S. exposure (more than 70%) far exceed the rest of the countries, I think it is justified to gauge their risks under the macroeconomic conditions in the U.S., which is what I will do next.
Source: PIMCO Source: PIMCO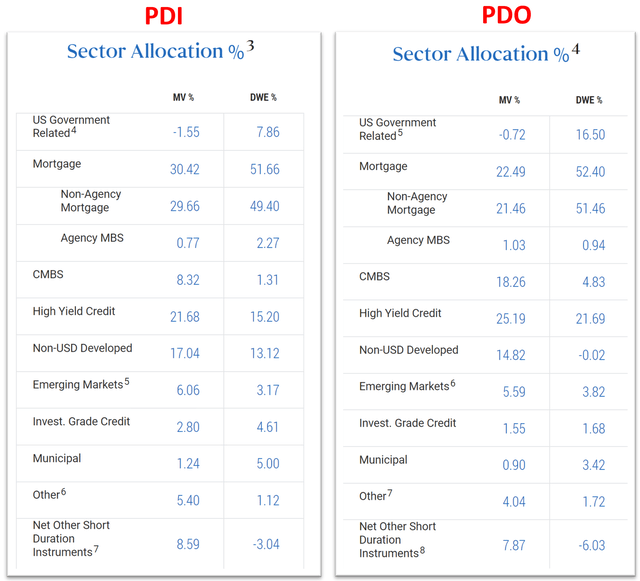
PDO and PDI – macroscopic risks
I consider the current macroscopic conditions to be very concerning for both types of assets that PDI and PTY heavily bet on. Here, I will concentrate on two of my top concerns: the inverted yield curve and the spread between the BAA and Treasury rates.
As seen below, the current yield spread between the 10-Year Treasury Constant Maturity rates and 2-Year Treasury Constant Maturity rates is -0.52%. To contextualize it, it is the deepest level of inversion in the past 3 decades. Even the 2000 episode did not reach this level.
An inverted yield curve can introduce heightened risks and challenges for high-yield funds like PDO and PDI, given their exposure. The main risks include price correction, income generation, default risk, and liquidity. In particular, both funds have high exposure to mortgage-backed assets, and I have a recent article specifically focused on the risks of an inverted yield curve on such assets. The gist is that such assets generate profit from the spread between long-term and short-term rates. A narrowed or inverted yield curve reduces their profit margin, but the negative impact can extend well beyond. For example, it could weaken the demand for mortgage originations and also trigger default risks, especially when combined with the high inflation ongoing now.
Source: FRED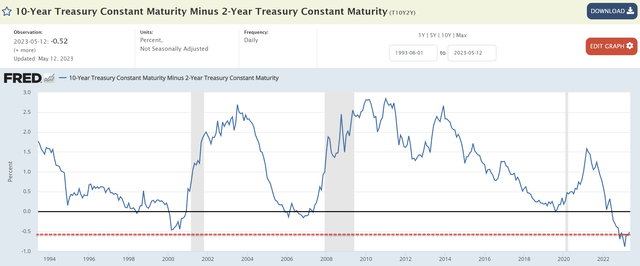
Second, the current yield spread between high-yield corporate bonds (top 2 largest exposure for both funds if you recall) and risk-free interest rates is also on the thin end of the spectrum. The next chart shows how narrow the spread is compared to the historical average using the spread between BAA bonds (lower-rated corporate bonds) and 10-year treasury rates. Such a narrow spread can impact high-yield funds like PDI and PDO in several ways like interest rate sensitivity, increased default risks, valuation risks, et al. But ultimately, a thin spread signals a high risk premium. High-yield funds invest in lower-rated bonds to generate higher yields, compensating for the increased credit risk. When the yield spread between BAA bonds and risk-free rates narrows, it means that the additional yield offered by high-yield bonds diminishes.
Source: FRED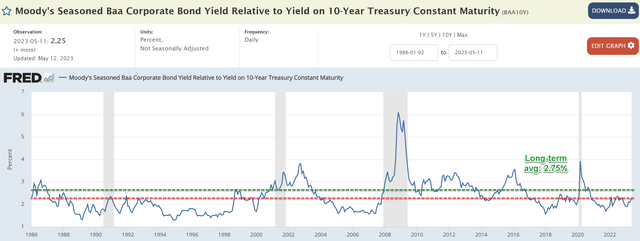
Historical performance
As aforementioned, given PDO’s short history, there is a lack of data to gauge its long-term performance. If the above analyses are sufficient to establish the similarities between these two funds for you (as did for me), then we can use PDI’s past performance as a guide for PDO.
Unfortunately, historical data are not in favor of PDI. The fund lagged substantially behind the S&P 500 in terms of total return (again, with dividends included). Of course, you could argue that income-oriented funds like PDI are not meant to be compared with the S&P 500 (represented by the Vanguard 500 Index funds). These funds are intended to generate income with manageable risks. The argument is debatable. First, you can also sell some S&P 500 funds to generate the income you need. And second, as seen, PDI also underperformed a simple 60-40 portfolio designed for the same purpose of generating stable income with manageable risks. Actually, the 60-40 portfolio achieved far better total return with far lower risks measured by standard deviation, worst drawdowns, and worst year performance.
Looking ahead, I anticipate this lag in total performance to persist for both PDI and PDO given the macroscopic risks analyzed above.
Source: Portfolio Visualizer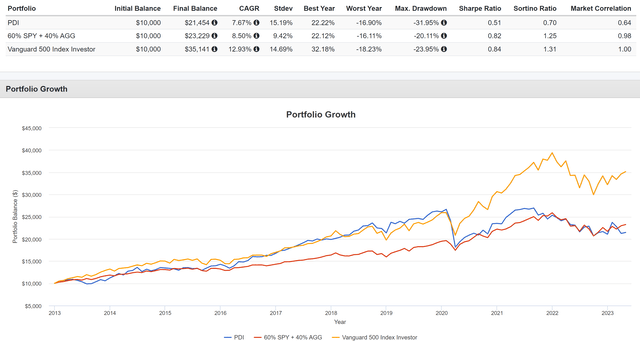
Upside risks and final thoughts
After spending the article thus far focusing on the downside risks, here I will point out a few upside risks for a more balanced view. First, their dividends are indeed attractive as seen below. To wit, PDI boasts a yield of approximately 14.6%, while PDO offers a yield of 11.8%. These yields are attractive both in absolute and relative terms. For example, in comparison to their own historical records, their current yields are 25% and 23% higher, respectively.
Source: Seeking Alpha data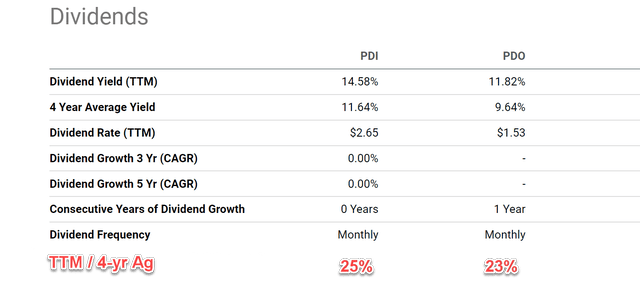
Both funds also use substantial leverage as seen below. Leverage is always a double-edged sword. Although if you do decide to leverage, there are certain advantages to letting the fund leverage rather than doing the leverage on your own. Run by a large corporation like PIMCO, the fund could have access to lower borrowing rates than you can get. The fund could also enjoy better liquidity when things go through a rough patch. Finally, both funds are currently at reasonable premiums compared to their NAV. As illustrated in the chart below (taken from CEFConnect), PDI is currently selling at a negative Z-score, and PDO is close to a Z-score of zero.
However, my overall conclusion is that I am seeing more downside risks than upside risks under current conditions. I assume many investors are drawn to these funds for their high yield. These yields are indeed very appealing on the surface. Investors need to be aware that in the end, total return is what matters, not yield. And given the macroeconomic conditions and the risk premium in high-yielding assets analyzed here, I see good odds for lagging total returns as PDI has suffered in the past.
Source: CEFConnect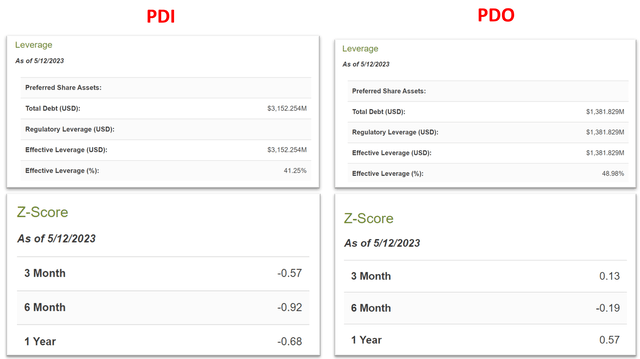
Read the full article here


