Stock Overview
In my second research note lately covering a utilities sector stock, Duke Energy (NYSE:DUK) is next up in my crosshairs after its recent earnings release on November 2nd.
A few interesting points about this North Carolina-based company: It has 8.2MM customers, its roots go back to 1900, and its name is tied to 19th-century tobacco entrepreneur James Duke. It has hydroelectric, coal, and nuclear power stations but also solar and wind farms. Owns over 58 thousand megawatts of power in the US.
Rating Methodology
The stock’s rating is based on its WholeScore, which is my approach to holistically rate a stock by considering 13 metrics of equal weight I think are relevant to investors and analysts. Key financial data presented is sourced from Seeking Alpha, however, in this note, I am taking a slightly different angle, and rather than use company earnings presentations I will refer to some third-party news and analyst sources.
Revenue Growth vs. Peers
The table below I created compares 5 peers I selected from the electric utilities sector, to compare YoY revenue growth.
In this peer group, although Duke did better than another peer I recently covered, NRG Energy (NRG), it came short of the peer average. It missed my target of 5% outperformance vs the average and lost a potential rating point in this category.
Duke Energy – growth vs peers (author analysis)
A November 3rd article from Morningstar highlighted the positive growth trajectory this company is on, which adds confidence to my hold rating:
Recently filed resource plans in North Carolina and South Carolina support a long runway of growth in the region.
Earnings in the quarter benefited from higher customer rates, customer growth, and cost mitigation measures, partially offset by higher interest expenses.
Revenue Growth (YoY)
From the income statement, we can put together a story when it comes to YoY revenue growth. In the case of Duke Energy, their growth was lackluster at 1.94% YoY growth, missing my 5% target and losing another potential rating point.
Duke Energy – revenue YoY growth (author analysis)
A November 2nd piece in Reuters highlighted the headwinds to revenue:
The Charlotte, North Carolina-based company missed revenue estimates, reporting $7.994 billion in the quarter versus expectations of $8.131 billion.
Earnings Growth (YoY)
Also from the income statement, we can see that YoY earnings had a nearly 12% decline, missing my 5% growth target and losing a potential rating point.
Duke Energy – earnings YoY growth (author analysis)
Fellow SA analyst Leo Nelissen in his November 3rd research note on this stock highlighted both the decline in earnings per share but also some cost drivers:
In the just-released third quarter of 2023, the company reported earnings per share of $1.59, with adjusted EPS at $1.94, compared to $1.81 and $1.78 in the previous year.
.. The company also expects increased financing costs due to higher interest rates.
On that point, consider that the company saw $774MM in interest expense in Q3, which I will discuss further in the section on key risks to keep in mind.
Cash Flow Growth (YoY)
When it comes to cash flow, we can see a much better scenario with nearly 123% YoY growth in free cash flow per share. This easily beat my 5% growth target and earned a rating point toward its WholeScore.
Duke Energy – free cashflow YoY growth (author analysis)
However, it is also worth noting that this company has had negative cash flow for the majority of the last year, as the table below from their cash flow statement shows:
Duke Energy – negative cashflow trend (Seeking Alpha)
Equity Growth (YoY)
Now turning to the balance sheet, we can see a slight YoY decline in equity growth, which missed my goal of a 5% positive growth, and therefore missed out on a rating point here toward its score.
Duke Energy – positive equity YoY growth (author analysis)
What is interesting to point out is that total assets grew on a YoY basis to $181.1B, but total liabilities also grew to $129.3B. A significant driver of the liability growth seems to be a spike in long-term company debt from $66B in Sept 2022 to $71.3B in Sept 2023.
3-Year Dividend Growth
For dividend-income investors, the good news from their dividend data is that they saw a 6.22% growth in dividends over 3 years. I created the table below by comparing the dividend from November 2023 with that of November 2020.
Beating my target of a 5% gain, it earned another rating point here.
Duke Energy – 3 year dividend growth (author analysis)
Earning just over $1 per share each quarter is a nice source of cash flow, in my opinion, considering that its peer Constellation Energy (CEG) is only paying $0.28 a share, and peer NRG Energy (NRG) pays $0.38.
In this case, I would go with Duke if I was putting together a dividend portfolio of utilities stocks.
Dividend Yield vs. Sector
Also from the dividend data, in comparing the forward dividend yield with that of the sector average, we can see that it beats the sector by 13.15%.
Combined with a dividend growth topping 6%, and a yield of over 4.5%, I think this stock has earned a spot in my “dividend quick picks” of the week.
Also, the yield beat my target of 5% outperformance vs the sector, so it got another rating point here towards its WholeScore.
Duke Energy – dividend yield vs sector (author analysis)
Share Price vs. Moving Average
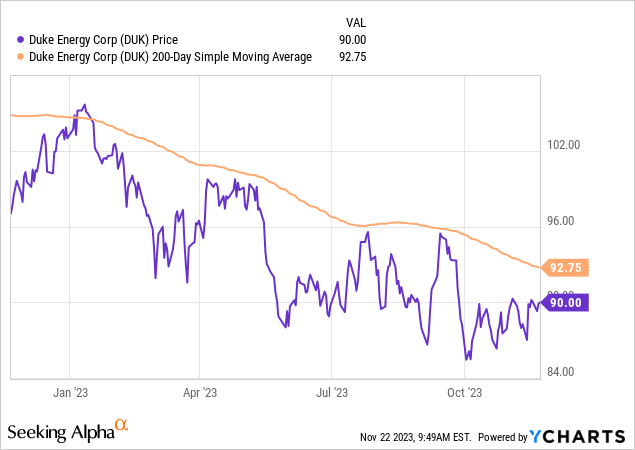
In my strategy, I am looking for dips below the 200-day moving average, and the below chart I pulled shows that there is not much in the way of “dip buying” considering it has traded below the average since early in the year, so in essence it is already in extended bearish territory.

I think that at 3% below the moving average, it presents a decent buying price at $90 (as of the writing of this article), however, if I bought into the $85 October dip then I am already up by $5/share now.
Duke Energy – share price vs moving avg (author analysis)
So, on the one hand, it could be a buy but also can be a hold for those October dip buyers. I would not call it a “sell” at the current price, which seems like it is throwing all the potential upside into the trash incinerator. The rebound back above the moving average ought to come after a quarter of strong YoY earnings growth of at least 10% as well as a significant earnings beat.
Price Return vs. S&P 500
In this metric, I am looking at the market momentum of this stock in comparison to the S&P 500 index which is a common index tracked.
In my table below, using data from Seeking Alpha I determined that this stock is underperforming the index by over 158% when it comes to 1-year price return. So, it did not get a rating point here, as my target was for a 5% outperformance of the index.
Duke Energy – performance vs S&P500 (author analysis)
In comparison, its peer NRG Energy also underperformed the index but also had a positive 1-year price return of just over 8%. Another peer, Constellation Energy, actually outperformed the index and achieved a 1-year return of 27.2%.
So, I don’t think the market momentum is weak on the sector itself necessarily but rather on Duke Energy, and I believe the drivers of this are earnings weakness combined with high debt.
P/E Ratio
The valuation metrics for this stock show a slight undervaluation in comparison to its sector average. I am actually looking for undervalued stocks so in this category it got a rating point toward its total score.
Duke Energy – P/E ratio (author analysis)
What I think is driving this valuation when tying back to the earlier financials I mentioned is that although earnings have declined somewhat the share price also has been bearish for a while too, so there is no major imbalance going on as would be the case if the share price suddenly spiked up above the moving average and earnings did not improve first.
P/B Ratio
The forward price to book value is even more undervalued and earned another point here toward its overall score.
Duke Energy – P/B ratio (author analysis)
I will keep it simple: tying back to the financials I discussed it appears the lower P/B value is related to the share price being bearish and trading below average while the equity has not dropped much. Keep in mind the company has just over $51B in positive equity, despite the debt loads.
Return on Equity
From the section on profitability, we can see that the trailing twelve-month return on common equity (ROCE) of 7.75% was just below the sector average by almost 15%. My target was for a 5% or better return vs the sector, so it missed here.
Duke Energy – return on equity (author analysis)
Again, the financials I went over show a very high equity of $51B but earnings have been weak and declining, so that appears to be driving this metric down.
In the comments section, let’s start a discussion. I welcome your thoughts on the question: how much importance as an investor do you place on the ROCE metric and why or why not?
Risk Score
The key risk that I already touched upon is increasing debt load and with that could come increasing interest expenses.
For example, debt went up about 8% on a YoY basis:
Duke Energy – long term debt (Seeking Alpha)
At the same time, quarterly interest costs went up about 28%, which is significant and can impact the net income.
Duke Energy – interest costs go up (Seeking Alpha)
I determined in my risk table below that both the risk impact and probability are moderately high, so the total risk score exceeds my target. Keep in mind this is in the context of having rising debt and interest expenses combined with weak revenue and earnings growth, but does not mean I think this company will have liquidity or solvency issues anytime soon.
Duke Energy – risk score (author analysis)
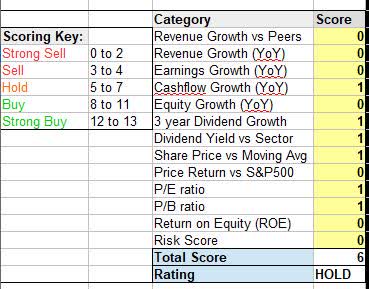
WholeScore Rating
Today, this stock got a WholeScore of 6, earning a hold rating from me
Duke Energy – WholeScore (author analysis)
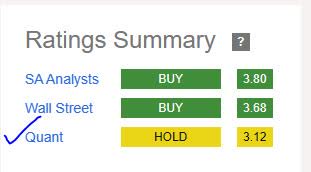
In comparison to the consensus, I agree with the sentiment from the SA quant system this time and think that Wall Street and SA analyst consensus is slightly too bullish for me.
Duke Energy – rating consensus (author analysis)
Summary and Forward Outlook
Like its peer NRG Energy, this is one of those stocks I consider a “critical infrastructure” stock because the company provides a critical service, utilities.
Its business model is also appealing as it can depend on a stable customer base paying their monthly utility bills.. “recurring revenue stream.”
Positive drivers of today’s neutral rating were a 4.5% dividend yield and proven dividend growth along with a $1.03 per share payout each quarter, as well as some improvement to cash flow finally and undervaluation.
Some challenges are weak revenue and earnings growth figures as well as underperformance vs the S&P 500 and underperformance in return on equity.
I think it is a solid dividend income play rather than a buy or sell at this stage.
Read the full article here


