Thesis
The trade of the year in 2023 has been to be long the so called ‘Magnificent Seven’:
- Alphabet (GOOGL),
- Apple (AAPL),
- Amazon (AMZN),
- Meta Platforms (META),
- Microsoft (MSFT),
- Nvidia (NVDA) and
- Tesla (TSLA)
The moniker was coined for the seven tech mega-caps as they outperformed in 2023. And some of them have indeed delivered explosive growth this year, with Nvidia reporting yet another EPS beat.
The above stocks have performed stellarly this year, with a backdrop of an otherwise drab market:
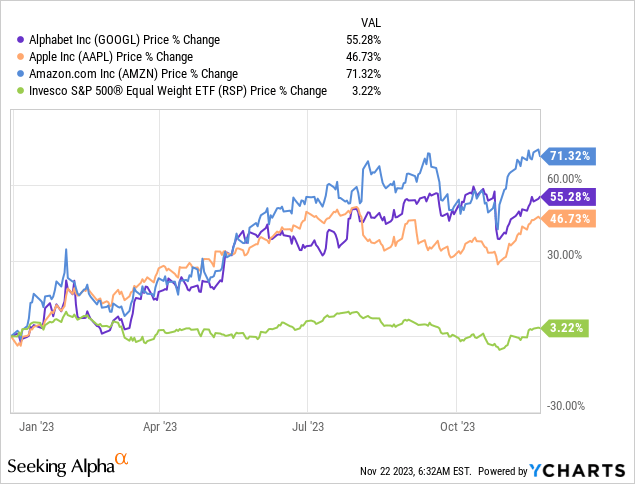
We are plotting some of the magnificent seven versus the Invesco S&P 500 Equal Weight ETF (RSP) in the above graph. RSP contains an equal weight of the largest 500 stocks, and has recorded a mere 3.22% gain in 2023. The differences in performance are astounding to say the least.
The main culprit for the divergence has been a market that herded towards strong balance sheet mega-caps, under the assumptions that a bullet-proof balance sheet and business moats in many sectors will not only protect profits but also create growth opportunities. We have seen some articulation of that thesis via the artificial intelligence trend this year, which indeed will change many aspects of society. The other facet responsible for the underperformance of mid- and small-caps, is represented by funding costs. With rates up significantly, many smaller companies will have to refinance debt or incur new one at higher rates, thus increasing their cost of capital and reducing profitability.
The Invesco S&P 500 Top 50 ETF (NYSEARCA:XLG) is an equity exchange traded fund. The vehicle aims to replicate the S&P 500 Top 50 Index. The S&P 500 Top 50 consists of 50 of the largest companies from the S&P 500, reflecting U.S. mega-cap performance. Index constituents are weighted by float-adjusted market capitalization and rebalanced annually.
This composition methodology results in XLG having an enormous exposure to the ‘Magnificent 7’, which make up 50.5% of the collateral pool. XLG is a very concentrated bet on the largest S&P 500 mega-caps, and has done tremendously well in 2023.
In this article we are going to analyze valuation metrics for the largest mega-caps and articulate why it would be prudent for a retail investor to monetize gains and reduce exposure to this sector.
Valuations are close to all-time highs
Remember the late 90s frenzy when everything that had a ‘.com’ in their name was a strong buy? Funnily enough today’s environment reminds us of those times:
Tech vs Index (BofA)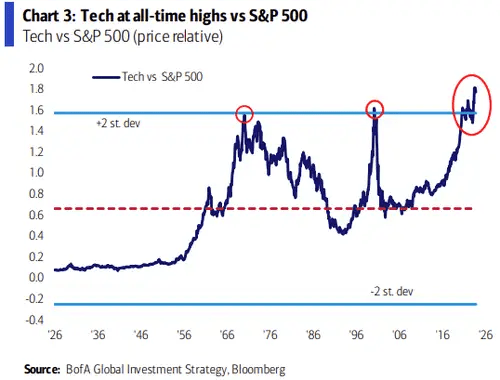
As articulated by BofA, tech (driven by the tech mega-caps) is at all-time highs versus the S&P 500. That ratio has gone above a +2 standard deviation, meaning it is extremely stretched. Everything eventually mean-reverts, as we can see historically, and we expect this time to be no different.
Let us have a closer look at P/E ratios, to get a better sense of how stretched this corner of the market is:
P/E Ratios (BofA)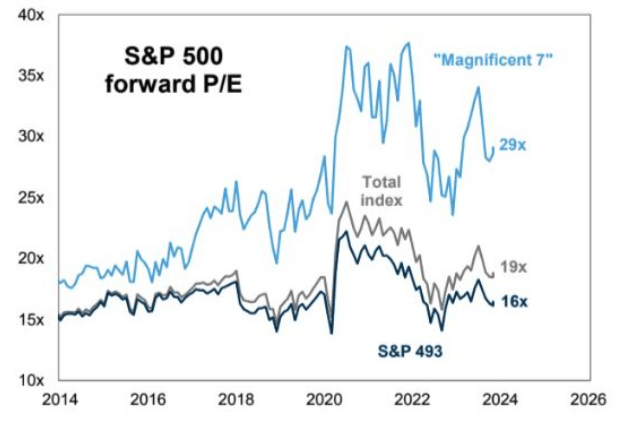
The magnificent seven are trading at a 29x P/E ratio versus only 19x for the S&P 500 and 16x for the S&P 493 (i.e. the index excluding the seven respective stocks). High P/E ratios result in poor long term results subsequently:
Future Returns (BofA)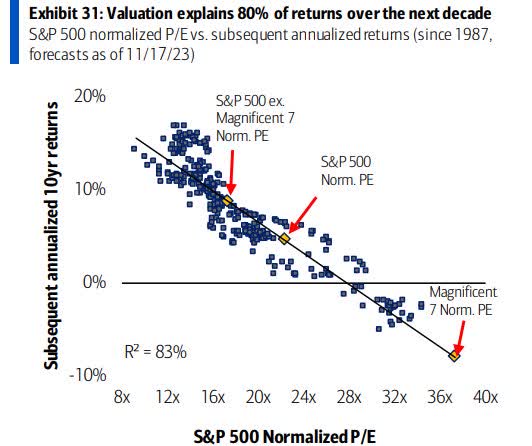
Bank of America’s analysis points to negative annualized 10-year returns following such stretched valuations. While we are taking this with a grain of salt, it is indubitable we need some sort of a ‘wash’ similar to what we have seen in 2022 in order to have a healthy annualized growth here.
Starting valuations matter, and the current ones are extreme to say the least.
This year has been profitable for XLG
If you were a holder of the name throughout the year, you would have recorded very attractive returns:
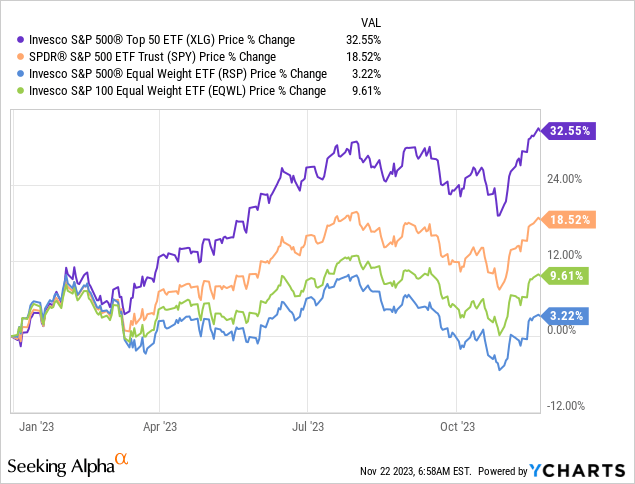
XLG has posted almost 2x the performance of the S&P 500, and has left in the dust other expressions of the index, namely the equal weight RSP and the equal weight EQWL that focuses on the largest 100 names.
With valuations stretched it is prudent for a retail investor to crystalize gains here and reduce exposure to this corner of the market, with expectations for a mean reversion to materialize.
What can you do if you do not want to sell outright
While the easiest way to reduce exposure is to sell XLG outright, there are other option based strategies that can be utilized as well. As an example an investor can sell a slightly in the money covered call, which will still provide upside if XLG keeps rallying, or conversely buffer the downside if pricing goes down.
On the Seeking Alpha platform, under the ‘Options’ tab, an investor can see the options traded on the name. While very illiquid and thinly traded, there are call options on XLG. The maximum maturity date we see here is June 21, 2024. An investor can choose to sell the $34 strike call, which on a binomial pricing model gives a mid level of $3.7 per contract. That translates into a $370 amount for each 100 shares of stocks (i.e. one contract). If an investor chooses to de-risk via this alternative, then they would pocket $37.7/share (34 strike + 3.7 option premium) versus current spot of $36.5 if the stock keeps rallying, or conversely have a buffer of $3.7 per share if the stocks goes down in value and the written call expires worthless.
Conclusion
XLG is an equity exchange traded fund. The vehicle aims to replicate the S&P 500 Top 50 Index, which is a market capitalization index focused on the largest 50 stocks in the S&P 500. This composition methodology results in the ETF representing a very concentrated bet on the ‘Magnificent Seven’, which make up over 50% of the holdings for the fund.
With valuations stretched at 29x P/E levels for the cohort, and with the tech sector at all time highs versus the index, mean reversion is to be expected. Healthy pull-backs are needed in order for positive long term returns to develop, and this time will be no different. We are of the opinion that retail investors would be well served to sell the name here, either outright or via options.
Read the full article here


