Investment Outlook
Excessive volatility, dislocated fundamentals, and macroeconomic risks are a distasteful recipe for the long-term investor. Performance of US benchmarks has lagged rolling into H2 ’23. The market’s character has changed following the November FOMC meeting. It is now forecasting a period of better business in the next 12-24 months.
This market, like any others, will appeal to different players at points along the income/capital appreciation scale. Multiple instruments exist that provide diversified tactical exposure and capture a reasonable combination of yield + capital appreciation. Others trade at fair value but deliver a persistent yield.
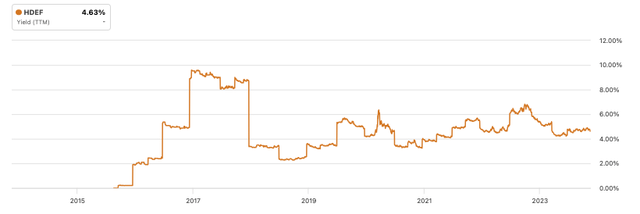
The MSCI EAFE High Dividend Yield Equity ETF (NYSEARCA:HDEF) sits in the latter camp. Since its inception, the fund’s distribution yield has been cyclical, moving within a range of 4-6% in recent years.
Dividends are paid quarterly and currently yield 4.6%, on a trailing payout of $1.06 per share. Distributions have indeed been lumpy as mentioned, but tend to follow a similar pattern over the last 7 years of consecutive payments at a 4% average yield.
The important takeout for investors:
(i). This is a well-defended supply of income, allowing future allotments in tranches at 4-5% avg. yield,
(ii). The companies you own in this fund (by nature of their inclusion to the benchmark) are high-quality cash compounders with robust economic characteristics to carry them forward.
Figure 1. HDEF distribution yield
Source: Seeking Alpha
Figure 2. HDEF Distributions (5-years)

Source: Seeking Alpha
The trade-off is capital gains. Being an income-based investment vehicle, the market captures the fund’s valuation well, discounting the expectations swiftly into market value. Cash flows are discounted at a fair cost of equity, and there is a fair consensus on price over the mid to long-term. Second, because of the ‘robustness’ of the portfolio, the holdings are impervious to many of the market’s machinations, including to the upside. Third, by their nature, the majority of these high-quality dividend names are mature businesses where the reinvestment runway for growth is limited (hence the strong dividend).
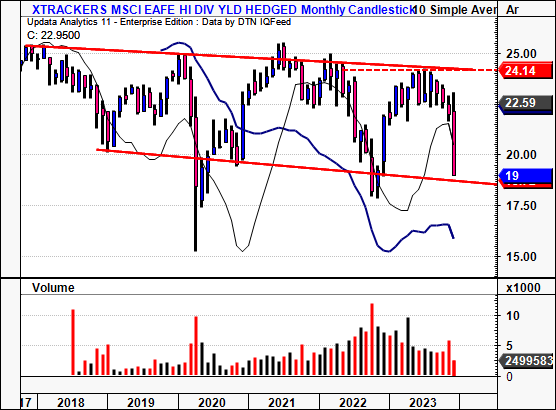
As such, valuation has rotated about a fair value depending on various factors and market cycles. This has opened up many opportunities to expand money-weighted yields on various pullbacks.
Figure 3.
Data: Updata
Critical facts that illustrate HDEF’s economic value to equity investors:
- Concentrated holding in high-quality companies where distribution for potential cash flows is predictable and high.
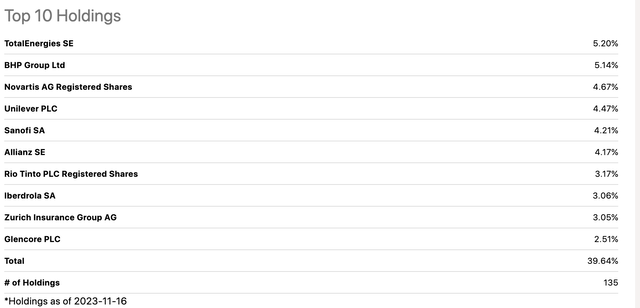
- Main weights are in financials (21.8%), basic materials (19.8%) and consumer defensive (12.2%). Technology has a 0.25% weighting, so this is a low-beta play on the equity exposure. The top 10 holdings make up ~40% of the portfolio. In my opinion, this is attractive. You get more meat off the bone of the portfolio that way as the value sources aren’t distributed across too many holdings. This ensures a stable weighted yield that one can average into over time.
- You own an extensive list of cash-compounding corporations. Some of the major positions (135 positions in total) are major purveyors in global society.
- The individual names making up the major positions are large, well-established firms with deep customer networks. Resources names such as Aussie mining giants BHP (BHP) and Rio Tinto (RIO) accompany Healthcare giants such as Sanofi (SNY) and Novartis AG (NVS), and you have an extensive list of these market movers. I am constructive on the outlook of these sectors (resources + healthcare). The more reliant we become on critical inputs, these companies are well positioned, so this is a long term view. See Figure 4 for full list of major holdings.
- AUM + performance
- The fund invests in non-US/Canadian equities, producing a portfolio of geographically diversified companies in one instrument. It tracks the performance of the MSCI EAFE High Dividend Yield Index with a full replication technique.
- With $1.4Bn in AUM it charges an expense fee of just 9bps on this, a reflection of the fact that (i) the fact it simply replicates the index with small value add, and (ii) turnover is modestly high at 29% annually.
- Importantly— it has a c.5% tracking error from its benchmark last 12 months and 6% last three years (85th percentile vs. all ETFs). So long as the underlying index’s inclusion criteria attract quality companies, HDEF appears to be an adequate way to get exposure (Figure 4a).
Figure 4.
Source: Seeking Alpha
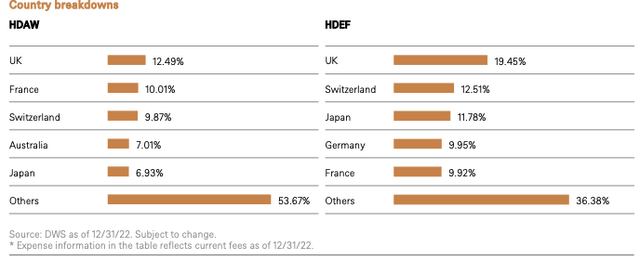
Figure 4a. “MSCI’s distinct index methodology seeks high-yielding companies while applying a series of screens, including dividend persistency, sustainability and quality with the goal of capital preservation and potential long-term capital appreciation“.
Source: DWS
The decision on investment in HDEF depends on one’s criteria: 1) investment horizon, 2) investment goals (yield, income, total return), and 3) risk preferences.
For those investors employing a long-term horizon and seeking investment income with global diversification benefits, HDEF is an appropriate fund selection in my view. I rate HDEF a buy for investors fitting this description. For those seeking capital appreciation, look through earnings growth and momentum; this is not the holding to consider.
Talking points
- Investment income from high-quality assets
Only around 30% of US-listed companies pay a dividend. If a firm can reinvest capital at above-market rates, it should compound its intrinsic value this way. Dividends reflect the ability to return surplus capital to shareholders—when free cash flows are high, and profitable reinvestment opportunities are sparse.
You also need the following criteria to sport a dividend:
(1). Earnings stability + sustainability, high-quality assets producing cash flow,
(2). Perpetually FCF positive, return on capital above the hurdle rate,
(3). Investor preferences to buy the stock,
(4). Durable cash flows + competitive advantage to produce income above basic needs and sustain a payout from residual earnings.
Only a certain list of companies fulfil these criteria and over an extended period of time.
Dividends are not a ‘get out of jail free card’ for any portfolio. Many companies with poor capital appreciation prospects return capital to their shareholders.
However, the MSCI EAFE High Dividend Yield Index — HDEF’s benchmark index, that it constructs the fund via with full replication — steps up the game in ensuring high quality companies enter the list.
According to MSCI, inclusions are made “with higher dividend income and quality characteristics than average dividend yields that are both sustainable and persistent. The index also applies quality screens and reviews 12-month past performance to omit stocks with potentially deteriorating fundamentals…”.
Quality is screened via a composite of ROE, earnings variability, debt to equity, and momentum. Then selections are made in ranking based on the highest dividend yields within the sample.
Adding the quality screen has several advantages:
- Exclude stocks with potential eroding fundamentals,
- Focus on profitability as (i) the core measure of business returns, and (ii) sustainability, growth of the dividend.
- Related to the above, ensuring company’s possess the economics to maintain dividends and their competitive position at the same time.
- Screening for quality removes the variance in valuation. You can pay a fair price for a great company. Or, buy it cheap, without fraying whether your small price is a statistical discount.
Investment income also remains a crucial method to recycle capital from corporations to investors. The composition of Russell 3000 dividends from 1985–’21 is observed in Figure 5, per
Mauboussin & Callahan (2023). Note that dividends remain an integral component of capital allocation by US corporations (and therefore investment income by equity holders). HDEF provides this to investors as a vehicle. Meanwhile, dividends continue to be on the list of top capital allocation priorities for managers in the modern day, averaging 4% of sales in total (Figure 6). So if only 30% of companies pay dividends in the US, that group are placing nearly 9-10% of all capital allocated to investors as dividends (Figure 5).
In my opinion, HEDF’s tilt on quality is an overlay of sensible fundamentals that prevent ‘yield chasing’. Instead, you have sound companies with comfortable yields that can sustain the performance of cash flows.
Figure 5.
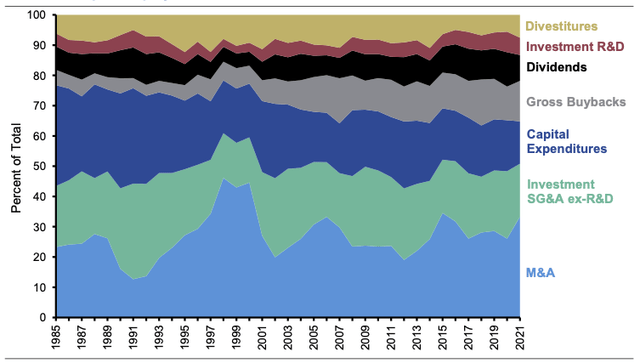
Source: Mauboussin & Callahan (2023): Capital Allocation
Figure 6.
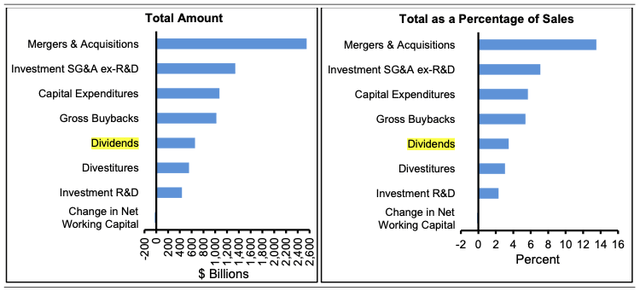
Mauboussin & Callahan (2023)
Cash-rich companies are the best positioned to return capital to shareholders. The trade-off is that many of these are at mature stages in the growth cycle and have limited opportunities to compound intrinsic value via earnings. These companies often struggle to extend multiples over time.
This is not an invaluable proposition. Consider the following:
- We can compare the holdings in a name like HDEF to instruments with similar risk, as in Figure 6a. Many investment grade and BBB grade corporates would also be similar in profile to HDEF’s holdings, without the capital appreciation. Yields on these notes are likely to be comparable and without the option for reinvestment.
- The defensive nature of these securities means their investment yields are stable and realized in cash. You are buying tangible, cash producing assets that are less sensitive to the rates/inflation axis.
Point being that (1) you own high-quality assets in HDEF, and (2) low volatility has its advantages when collecting dividend income. Compared to relevant peers, it has performed reasonably well. Most notably in dividend growth, of 14.7% in the last 2 years. A 4.75% 4-year weighted average yield is noteworthy as well, and compares with the yields we have only now seen in short rates and the long bond in ’23.
What are the advantages here though? Again it relates back to the portfolio benchmark’s bias to including high-quality companies as its constituents. Intelligent investors know that owning such names is key to compounding wealth. So in HDEF, you have a diversified selection of quality, dividend paying companies that seems to average 4% or so div. yield. In my view that’s what sets the fund apart from its peers.
Figure 6a.
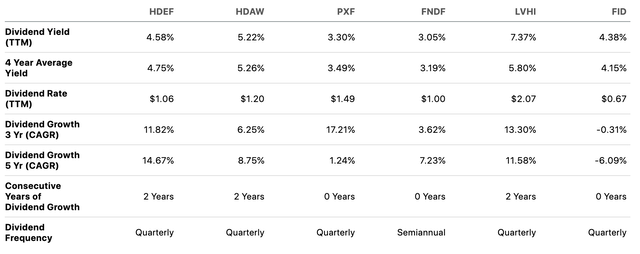
Source: Seeking Alpha
- Economics of investment income add major value
Regarding yields, HDEF’s non-US exposure has delivered low-volatility rates in the last 5-years (Figure 7). Investors have enjoyed an average 4-5% yield with regular allocations, with times of 6%+ rates available.
Total shareholder returns are satisfactory as a result. As seen in Figure 8, price returns of the shareholder capital in HDEF have been flat over a 1-5-year period. This is acknowledged immediately in this report. Contrast this to returns with all dividends paid up:
- 3-year and 5-year total returns for HDEF are at 20.5% and 31.2%, respectively, all driven by investment income.
- More importantly, dividend income provides optionality in capital reallocation. To illustrate, reallocating investment income obtained through HDEF’s distributions, received at the average 4-5% yield in the last 1-3 years, would have matched the S&P 500 index’s total shareholder return (Figure 8).
Figure 7.
|
Year— |
Average Yield | Max Yield | Min Yield | |
|---|---|---|---|---|
| 2023 | 4.70% | 5.39% | 4.22% | |
| 2022 | 5.46% | 6.82% | 4.48% | |
| 2021 | 4.65% | 5.69% | 3.76% | |
| 2020 | 4.13% | 6.35% | 3.24% | |
| 2019 | 4.34% | 5.70% | 3.19% | |
Data: Seeking Alpha
Figure 8.
| Measure— | YTD | 1Y | 3Y | 5Y |
| HDEF Price Return | 5.23% | 8.77% | 3.01% | 3.01% |
| S&P 500 Index | 17.42% | 12.94% | 25.75% | 65.12% |
| HDEF Total Shareholder Return | 9.72% | 13.91% | 20.48% | 31.89% |
| S&P 500 Total Return | 19.14% | 14.88% | 31.83% | 79.95% |
| Return with HDEF dividends reinvested to SPY | 21.72% | 18.40% | 30.65% | 69.82% |
Data: Bloomberg Finance, BIG Insights
By extension, 4–5% starting yields on an equity instrument that owns high-quality assets dispersed across the globe is a bedrock for long-term compounding strategies. Investors can recycle the cash flows obtained on their HDEF securities (and similar) into assets destined to compound intrinsic value. This includes individual securities and cross-assets. In that vein, adding HDEF to the long account is supported for investors with long-term investment horizons who wish to compound wealth and avoid excessive drawdowns.
Discussion Summary
The scope for investment income when owning equities has strengthened in a higher-rate world with tightening financial conditions. Rates on cash, Treasuries and credit have set the benchmark exceptionally high for equities on yield. Only the highest quality companies with exceptional economics are comparable in the current market. HDEF offers this selection for those seeking global diversification of investment income with an equity allocation, with stable yield, low volatility, and high-quality assets forming the portfolio.
It is priced well, too, at 9.9x earnings, below the ETF category average, and just above FactSet’s 6.6x segment average. Combined with a 4% average yield, the total owner earnings yield is ~14% with these figures (TTM values). In summary, the investment facts pattern displays:
- You are buying a 14% trailing owner earnings yield in HDEF at 9.9x earnings,
- The fund’s dividend income is well supported by its underlying assets— i.e., companies with cash-producing assets that throw off piles of cash to shareholders to sport dividends,
- The case for owning investment income is increasingly attractive as a measure to balance returns and redeploy capital to selective growth opportunities.
Considering these points, I rate HDEF a buy, given its propensity to create value for shareholders.
Read the full article here


