Stock Overview
Sparks could start flying in today’s research note as I cover my first stock in the electric utilities sector, NRG Energy (NYSE:NRG).
Here are some interesting facts you may not know about this Houston Texas-based firm, according to their website: 7.3MM customers served, member of Fortune 500, calls itself North America’s largest energy provider, provides power solutions for homes as well as businesses/organizations such as the 1,345-acre campus of the Texas Medical Center.
Rating Methodology
The stock’s rating is based on its WholeScore, which is my approach to holistically rate a stock by considering 13 metrics of equal weight I think are relevant to investors and analysts. Key financial data presented is sourced from Seeking Alpha as well as the company’s recent fiscal 2023 Q3 earnings release that came out on November 2nd.
Revenue Growth vs Peers
In the table below, I picked 5 peers within the electric utilities sector to compare each other’s YoY revenue growth. These are generally large and established companies in this space.
The peer group as a whole had an average 8.39% YoY revenue growth, yet my target stock NRG had a negative -2.81% growth in this period, coming in below the average. My target was to achieve 5% or better vs the average, so it did not get a rating point in this category.

NRG – growth vs peers (author analysis)
Personally, I would consider this segment part of the nation’s critical infrastructure, and as an investor, I am inclined to want to invest in this space for that reason.
Because companies like this provide a “utility” that is regularly consumed, much like the water faucet, it also can rely on recurring revenue streams from a regular customer base of homes and businesses who need the utility to function.
Companies like NRG have a large scale and market penetration. For instance, looking at the graphic below from their Q3 presentation, their electric volume was 47 Terawatt-hours while their natural gas volume was 400 million decatherms. To simplify, consider that just 1 Terawatt-hour equals 1 trillion watts of energy for an hour.
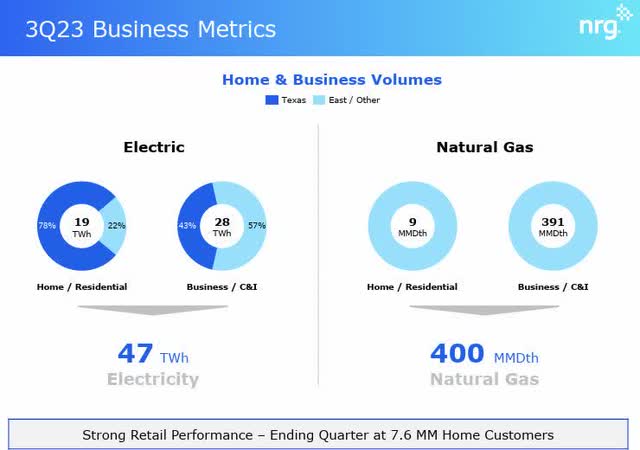
NRG – power volume Q3 (company Q3 presentation)
Some of the challenges faced by this sector that are relevant to understand about this business include instances of power grid failures or overload, like what happened in Texas a few years ago. I should know since I was residing there during a freak snow and ice storm a few winters ago that resulted in several days of power grid failure.
This past summer, an extremely hot one, saw record-level power demand which I am sure put extra strain on the grid, and you can see in the graphic below that August and September were especially straining on the demand:
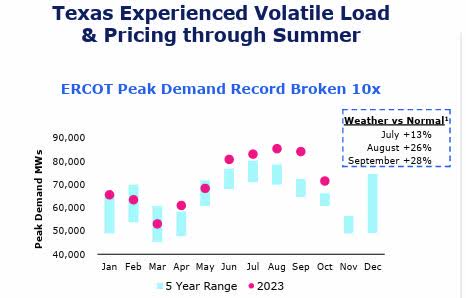
NRG – peak loads reached summer 2023 (NRG Q3 presentation)
So, to understand NRG and its business is simple: they provide a critical utility and make money regularly if you pay your power bill on time each month, while they also have to ensure the power supply actually works especially those days you want to crank the air conditioner up high.
The way it grows revenue is essentially acquiring new customers: households and businesses who open an electric account.
Although its performance relative to its peer group shown was mediocre, in terms of acquiring new customers it did show a growth in home customers:
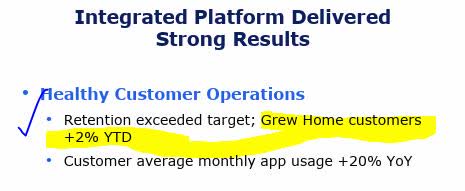
NRG – home customers growth (company Q3 presentation)
Revenue Growth (YoY)
From its income statement, we can see that the YoY revenue growth when comparing quarter ending this September with the same quarter a year ago was negative – 6.63%. My target called for 5% or better growth, so it was missed and also did not get a rating point here for that reason.

NRG – revenue growth YoY (author analysis)
Earlier, we mentioned its mediocre overall revenue growth vs some of its peers in this space, but also the fact that it managed to add some new customers in that quarter. One factor they mentioned will help revenue this year is the sale of its “STP” and “Gregory” businesses worth $1.5B.
They also are looking to offer value-added solutions to existing customers. According to their presentation, they also “launched new indoor camera and smart indoor lighting solutions” as well as “increasing products per home while decreasing cost to serve: Service Margin +9% YoY.”
I think this upselling of various other solutions that some of their peers may or may not be offering could set them apart going forward, and help in revenue generated per existing customer.
Earnings Growth (YoY)
Also from the income statement, we can see that there is better news in terms of earnings / net income, which seems to have grown nearly 412% on a YoY basis. This easily beat my goal of a 5% or better growth and earned a rating point here.

NRG – earnings growth (author analysis)
More good news is that the company has upgraded its own guidance for FY2023 EBITDA, so my sentiment on its earnings going forward is a positive one.

NRG – 2023 updated guidance (company Q3 presentation)
Cash flow Growth (YoY)
From its cash flow statement, more great numbers as the company went from a negative free cash flow per share in September 2022 to a positive $1.73 per share in the most recent quarter, achieving a nearly 127% YoY growth.
This beat my goal of a 5% growth, and earned another rating point here.

NRG – cash flow growth YoY (author analysis)
Positive cash flow growth I think is a good sign of effective management. Consider that according to its Q3 release:
Cash Provided by Operating Activities was $566 million, and Free Cash Flow Before Growth Investments (FCFbG) was $355 million.
This only adds to my positive sentiment on this firm’s fundamentals going forward.
Equity Growth (YoY)
An item on the balance sheet that I look at is whether a company has positive equity and whether it is growing or not.
In this case, NRG had a 31.4% YoY decline in equity, so it missed my goal of a 5% increase and did not get a rating point here.

NRG – equity growth YoY (author analysis)
After investigating, although cash increased YoY and total liabilities overall decreased, one factor that seems to have impacted equity is a steep drop in total current assets.
In fact, it saw a roughly 50% drop:

NRG – total current assets drop (Seeking Alpha)
What seems to have driven this includes drops in inventory, restricted cash, and “other” current assets.
It should also be noted that long-term debt has gone up on a YoY basis, however, the company has been diligent in trying to get that down.
Here is what they had to say on that from their quarterly earnings comments:
As part of the plan to achieve its target investment grade credit metrics, the Company plans to reduce debt by $1.4B in 2023 with $900MM funded from cash from operations and an additional $500MM with proceeds from the sale of STP. As of October 31, 2023, NRG had reduced debt by $800MM.
3 Year Dividend Growth
Now, let’s talk briefly about dividends, one of my favorite topics. I created the table below to compare the quarterly dividend from Oct 2023 with that of Oct 2020, and noticed it grew about 26% in that 3-year period.
My goal was for 5% or better growth, so it beat my goal and earned a point here.

NRG – dividend growth (author analysis)
This is evidence that the company has been committed to returning capital back to shareholders, and for an investor, it means a nice quarterly cash flow opportunity from just holding on to this stock.
Dividend Yield vs Sector
When comparing the dividend yield with that of the sector, it is 21% lower than the sector and therefore did not win a rating point here from me, as I am looking for it to beat the sector average.

NRG – dividend yield vs avg (author analysis)
If I were shopping for a better dividend yield, I would go with its peer Duke Energy (DUK) whose forward dividend yield is 4.56% as of this writing.
In addition, peer FirstEnergy (FE) currently has a fwd dividend yield of 4.41%, also much better.
One thing that could help bring the yield up is a drop in share price, and that is what I will go into next, the highly inflated price of this stock.
Share Price vs Moving Average
I include this section to present a very simplified approach to deciding if the share price presents a great buying opportunity right now or not, by comparing it relative to its 200-day moving average.
In this case, as of this article writing the share price was $48.08 and significantly above the moving average as you can see below:
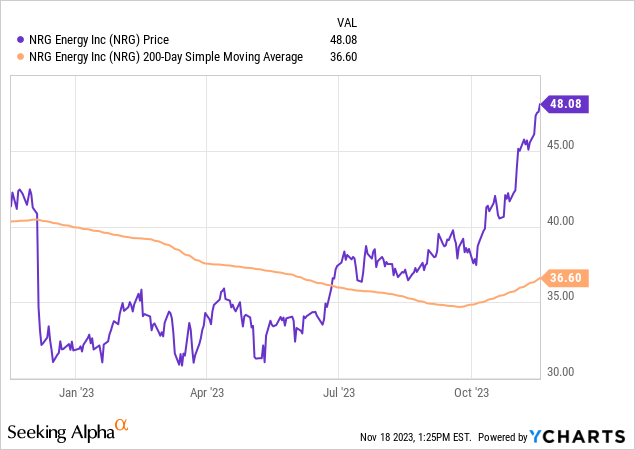
In my portfolio strategy, I am looking for dips of 5% or more below that long-term moving average. You may wonder why I go with the “5%” number and if there is some rhyme or reason behind it. It is simply an easy-to-explain “framework” I can use as a benchmark that is conservative and not too extreme one way or another.
With that said, my table below shows the current share price as being over 31% higher than the 200-day average, which I think is overbought and quite inflated really, especially for a company struggling to grow revenue vs its peers.

NRG – share price vs moving avg (author analysis)
It is, however, highly profitable with earnings growth and I think this is what is keeping the bulls charging after it. Still, the price does not really scream “buy me” at this level, but perhaps sell at a capital gain or hold on and earn that dividend cash flow.
If you look at the chart again, for those that bought around June when the price was in the $32 range now they are seeing something like a $16/share gain! On a 100-share position that is already $1,600 in potential profit on a sell right now. Or, hold on and earn $37 per quarter in dividends on that same 100-share investment. The two strategies also have different tax treatments too, qualified dividends vs capital gains, and something to research further.
Price Return vs S&P 500
The market momentum has improved for this stock lately, after performing well under the S&P 500 index for most of the year now, it is beating it by over 13%. My goal was for it to outperform by 5% so this target was easily beaten, and I gave it a rating point here for that reason.

NRG – performance vs S&P 500 (author analysis)
Here, it did better than its peer Duke Energy who saw a 1 year price return of negative -5.77% in this same period.
Again, I think the key metric driving this bullish momentum is the 412% YoY earnings growth along with positive cash flow growth too.
P/E Ratio
When it comes to the valuation, we can see some undervaluation in the forward P/E ratio which is about 43% below the sector average, and earning a rating point from me here.

NRG – P/E ratio (author analysis)
What I suspect is driving this undervaluation is what I mentioned already from the financials, and that is the spike in earnings growth. Now, if the share price and bullish momentum can calm down a bit it ought to bring down the P/E even more. This could of course attract more buyers, however and push the price back up, especially buyers looking for an undervaluation opportunity.
P/B Ratio
It was not so much in the “green” with its other valuation metric I looked at, the forward price-to-book value, which is showing as 68% above the sector average.

NRG – P/B ratio (author analysis)
On this one, I think the driving force is the drop in equity combined with a rising share price, causing a significant disparity. Again, if equity improves and the price calms down, this metric could lower as well. With the company’s debt-reduction plan in motion, I am anticipating an improvement in book value going forward, as total liabilities decrease with the decreased debt load thereby helping boost equity.
Return on Equity
Here, we will briefly take a look at the trailing twelve-month return on common equity, a typical metric to track the return common shareholders are getting on their investment of common stock.
In table below I created, you can see that the return on equity is actually negative, and also nearly 600% below the sector average, not getting a rating point from me here.

NRG – return on common equity (author analysis)
I like to cite Investopedia’s explanation in this situation: when net income is negative, ROE will also be negative. For most firms, an ROE level of around 10% is considered strong and covers their costs of capital.
Based on that benchmark, one look at the income statement tells me the company had 2 quarters where they posted net losses, and for the last year overall they are technically at a net loss, so this is what would be driving this metric.

NRG – net losses (Seeking Alpha)
Risk Score
The key risk I discovered, which I touched on briefly earlier, is the high debt load and corresponding interest expenses.
As you can see in the balance sheet, the long-term corporate debt has gone quite a bit on a YoY basis, and this is of concern in the current high interest-rate environment.

NRG – rise in debt (Seeking Alpha)
Correlating with the rising debt is a rising interest expense, shown in the table below, also from the income statement:

NRG – rise in interest expense (Seeking Alpha)
However, an offsetting factor to this risk is the company’s commitment to execute a debt paydown strategy, much of which is already in motion, as you can see below:

NRG – debt reduction plan (company Q3 results)
So, I am giving it a medium risk impact and medium/high risk probability, for a total risk score that is still within my tolerance levels. I believe the company’s cash flow strength I mentioned earlier will also be a positive offsetting factor.

NRG – Risk Score (author analysis)
In addition, three credit rating agencies have all given this firm a stable rating so far:
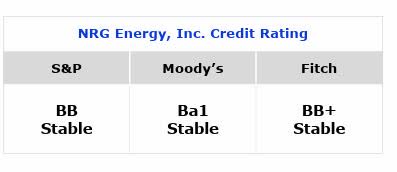
NRG – ratings (company Q3 presentation)
WholeScore Rating
Today, this stock earned a WholeScore of 5, getting a hold/neutral rating from me.
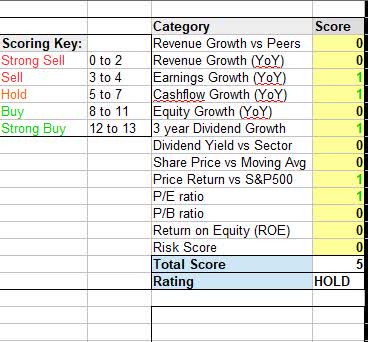
NRG – WholeScore (author analysis)
From the current consensus on this stock from its profile page, I would say I agree with the SA quant system which also shows a “hold”, whereas I think the buy rating consensus from Wall Street and SA analysts is being overly bullish right now.
Summary and Forward Outlook
While the overinflated share price is tempting me to say sell, all the factors combined that I discussed have turned this into a modest hold rating, creating a dividend-income opportunity perhaps.
As for my outlook on Q4 and end-of-year earnings due out in late February, my sentiment is modestly positive and this is driven by good earnings results and forecasts, as well as an effort to bring down debt.
More importantly, I like the recurring-revenue business model of having a reliable base of utility customers paying you each month and depending on you to keep the lights on and the heat working at their home or office.
However, as we have seen with challenges to power grid stability in recent years, this critical utility infrastructure has no shortage of headwinds and challenges it faces. I anticipate new investments in the millions to upgrade and maintain all of this infrastructure to even be able to support the needs of the next decade and beyond.
For now, NRG is worth being added to my watchlist and kept an eye on.
Read the full article here


