Summary
I have been searching for ways to generate higher yields and came across Business Development Companies (BDC) that function like REITs, paying out 90% of their earnings and having leverage limitations. Most BDCs lend money to medium-sized businesses but they are not regulated as banks and do not take deposits. This makes the business model high-risk and dependent on the BDC’s ability to lend, secure, and collect. However, to offset non-payment, BDCs usually obtain liens and other guarantees.
Despite being high-risk, BDCs offer a considerable yield of over 10%, which is often paid out monthly. However, it is important to remember that when an investment seems too good to be true, it probably is. To mitigate risk, I discovered the VanEck BDC Income ETF (NYSEARCA:BIZD), which invests in a portfolio of BDCs. After conducting a bottom-up analysis using consensus estimates, I have a very favorable view of the ETF.
Performance
Due to the rising interest rates and general fear of recession, BDCs have faced risk aversion. The BIZD ETF, however, has only decreased by 9% since November 2021, which is better than the -13% simple average for the portfolio and has avoided some -20% hits.
BIZD & Holdings Performance (Created by author with data from Capital IQ)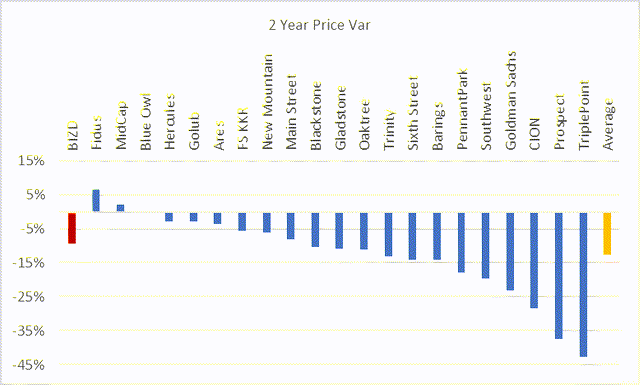
Expense Ratio
The reported expense ratio of 11% is inaccurate due to SEC regulations. It represents the aggregated cost of all BDCs in the portfolio, as explained by the ETF below.
Expense Ratio Explained (Image by VanEck)
Portfolio Overview
The BIZD has 25 BDCs in its portfolio, and a significant portion of it is invested in Ares Capital (ARCC), FS KKR (FSK), and Blue Owl Capital (OBDC), which together account for 44.5% of AUM. I used consensus estimates to determine the portfolio’s share price upside, dividend yield, and ROE, which are in line with the simple average and indicate a high degree of homogeneity. However, TriplePoint (TPVG) stands out with a 16% dividend yield, most likely due to a 40% price decline.
BIZD Consensus Price Target (Created by author with data from Capital IQ)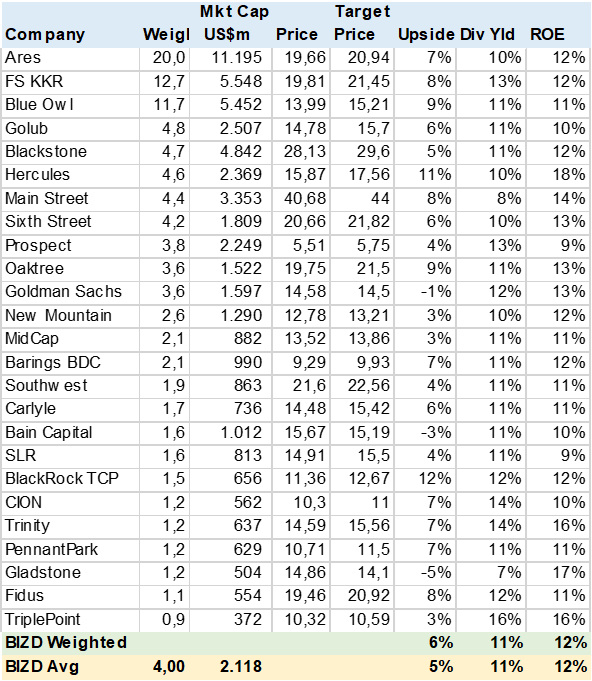
BDC Operating Overview
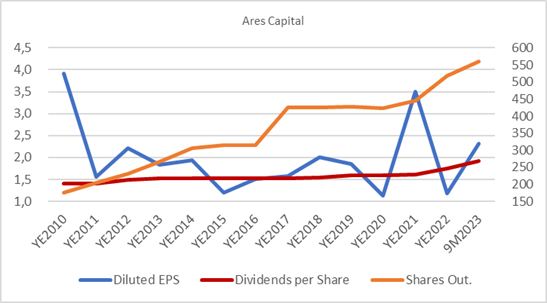
To gain a better understanding of the BDC business model, I analyzed Ares Capital in greater detail. As previously noted, a BDC primarily focuses on lending to small and medium-sized enterprises (SMEs). Ares, for instance, has extended loans worth US$22bn to over 400 SMEs and private equity firms. The company’s loan portfolio has grown at an average rate of 14% per year and much of this growth has been funded by new capital due to dividend distribution requirements. Ares’ share count has tripled since 2010.
Upon examining Ares’ income and balance sheet, it becomes apparent that the average loan rate has been around 11%, while debt cost is 4%. This results in a net interest margin of 7%, which is about double that of most banks. Bad debt costs, or credit write-downs, have averaged 1%, with some years being positive. It is worth noting that BDCs do not report this item as bad debt but rather as gain/loss of investment. Finally, the SGA (Selling, General and Administrative) costs to run the business are under 30% of NII (Net Investment Income), which is again better than most banks.
While the BDC should grow dividends, it is important to note that this growth will occur at a slower pace than that of the loan book due to the need for capital, i.e., share dilution. It is essential to recognize that nothing is perfect.
Ares Capital Financial Summary (Created by author with data from Ares Capital) Ares Capital EPS, DPS and Share Count (Created by author with data from Ares Capital)
Dividend Growth
Based on my calculations, the ETF is expected to have a negative dividend growth of 2% and 5% for the years ending 2024 and 2025, respectively. However, it is anticipated to maintain a dividend yield of over 11%. There are a few possible reasons why the market may be estimating a decrease in dividends. Firstly, there could be pressure on NII (Net Interest Income) as debt costs increase, which may not necessarily be passed on to loan rates. Secondly, there could be higher costs related to bad debt. Finally, there may be a need for more capital to support growth.
BIZD Consensus Dividend Growth (Created by author with data from Capital IQ)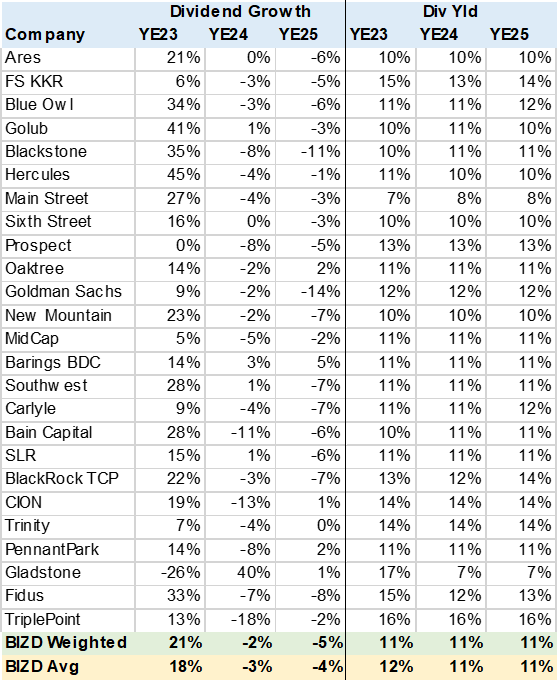
ROE and ROA
According to YE24 estimates, top US banks like JPMorgan (JPM) have an ROA of 1.2% and ROE of 14%. In contrast, BDCs have higher ROA due to increased loan margins, but their ROE is lower because they require more capital. Although BDCs are highly profitable, they cannot compete with commercial banking due to their capital requirements and lack of Fed funding. Nonetheless, it remains a lucrative niche.
BIZD Consensus ROE & ROA (Created by author with data from Capital IQ)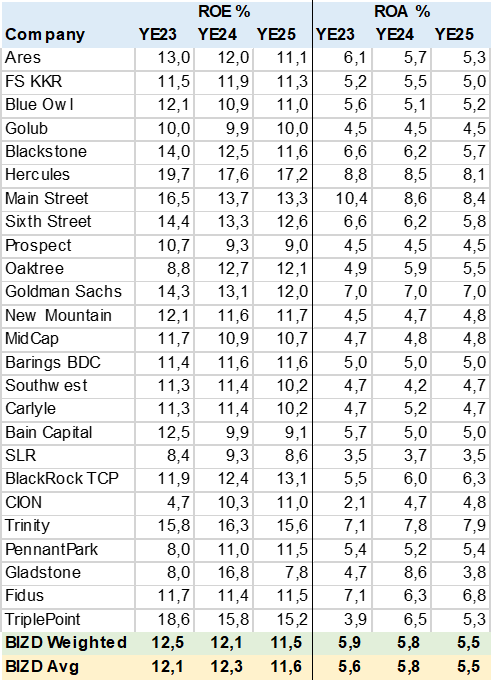
EPS Growth and Valuation
After analyzing the ETF using consensus estimates, I computed the EPS growth and PE of the ETF. It was evident that the EPS growth was comparable to dividends because of the 90% payout requirement. The PE multiple of 8x is lower than those of major commercial banks but higher than that of many regional banks that have to bear the brunt of higher funding costs.
BIZD Consensus EPS Growth (Created by author with data from Capital IQ)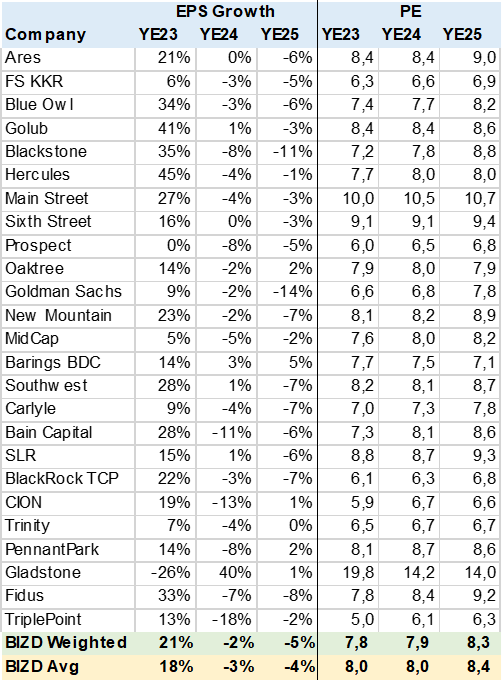
Conclusion
I strongly recommend buying BIDZ. The BDC business model is highly profitable and specialized, which should support high dividend payouts and yields, but not necessarily growth. Adding the ETF to the investment portfolio can provide further diversification and risk reduction without sacrificing significant yield.
Read the full article here


