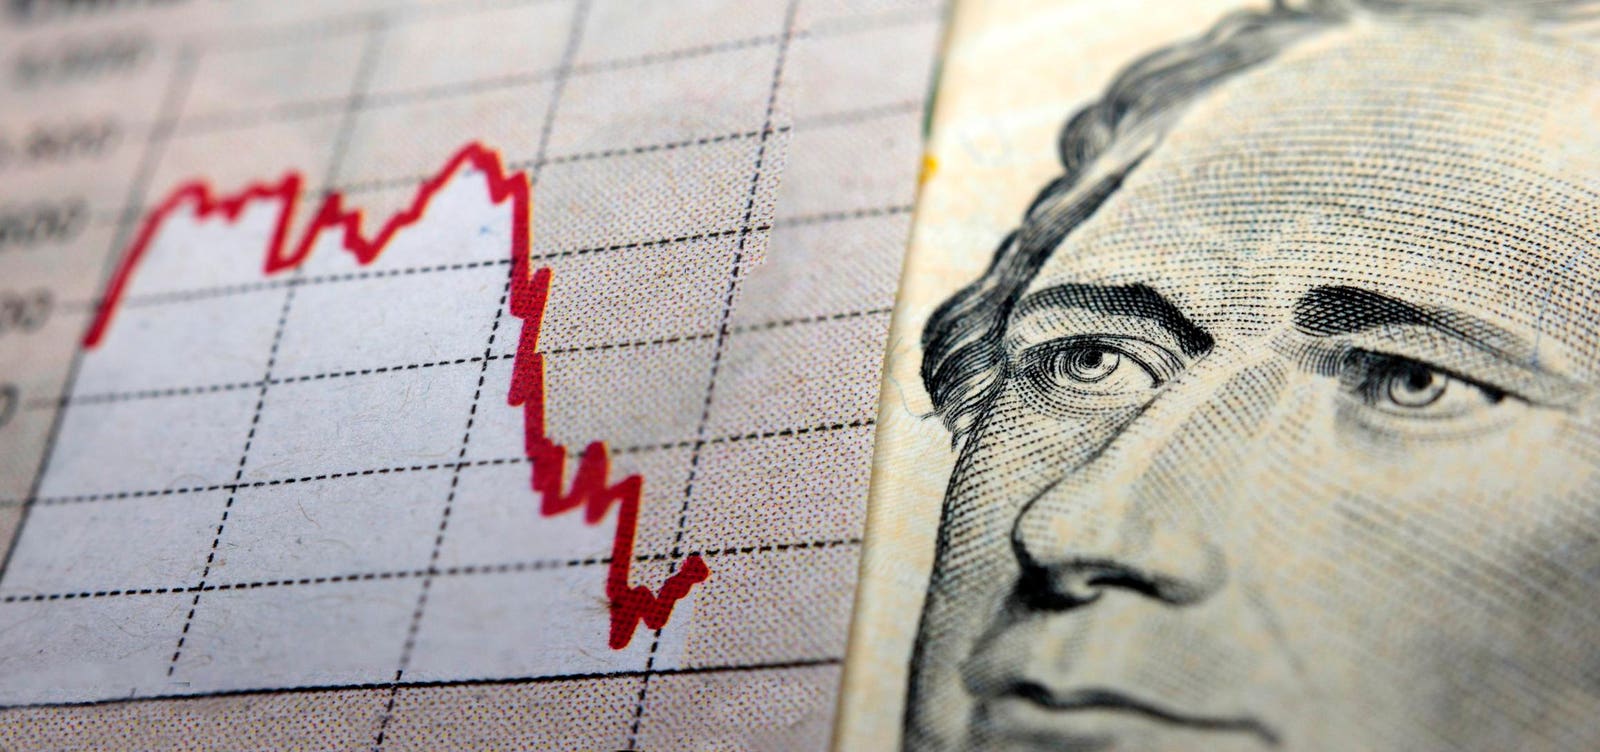
October is joining September and August for months this year that the Dow Jones Industrial Average made the journey from high at the beginning to lower prices by month’s end.
The closely watched measure of the really big stocks in the market rallied from time to time but never enough to erase the amount of loss that showed up on the days of selling.
Although economic reports showed strength — gross domestic product increased 4.9% in the 3rd quarter — investors seemed to be looking at interest rates rises as the disturbing factor mitigating anything else. With Treasury bond yields topping 5%, the dumping of Dow stocks kept picking up speed through October.
These price charts show the down trend problem for 4 of the largest components as measured by market capitalization.
Apple
AAPL
CAT
CVX
AAPL
CAT
CVX
The daily price chart for Apple looks like this:
The largest of the Dow components, with a market capitalization of $2.669 trillion, the stock in late October broke below the September low of $167.50 and then bounced. Despite the slight recovery, it remains below the 200-day moving average (the red line) and the 50-day moving average (the blue line).
The red dot-and-dash line connecting the late July high with the early September high demonstrates the general angle of descent for the last 3 months.
Caterpillar, with a market cap of $116.71 billion, has this kind of daily price chart:
You can see the early August high of just above $290 and the current price of $226.05, a 3-month drop from the peak to the present of 22%.
The October 31st gap down takes it below the mid-June dip and the selling comes on heavy volume. The 50-day moving average is now trending downward and the 200-day moving average appears to have turned that way as well.
Here’s the Chevron daily price chart:
The sellers of this giant oil company — market cap is $277.91 billion — were serious about getting out. The stock gapped down late in October, dropped below the March support level and stayed there.
It’s well below the 50-day and the 200-day moving average, both of which are down trending.
J. P. Morgan is a Dow component with a market capitalization of $401.93 billion. The big bank’s daily price chart is here:
Here’s another instance of one of the big ones peaking in late July and which then is unable to sustain a rally to even close to that level again.
The concern here is that the stock has now closed below its 200-day moving average for 3 straight late October sessions. The 50-day moving average has turned over and now heads down.
For the Dow Jones Industrial Average to move higher, the above majors will need to turn around and get going again.
Here’s the daily price chart for the Dow:
I’m no longer on Twitter — I’ve moved to Threads. net.
Read the full article here


