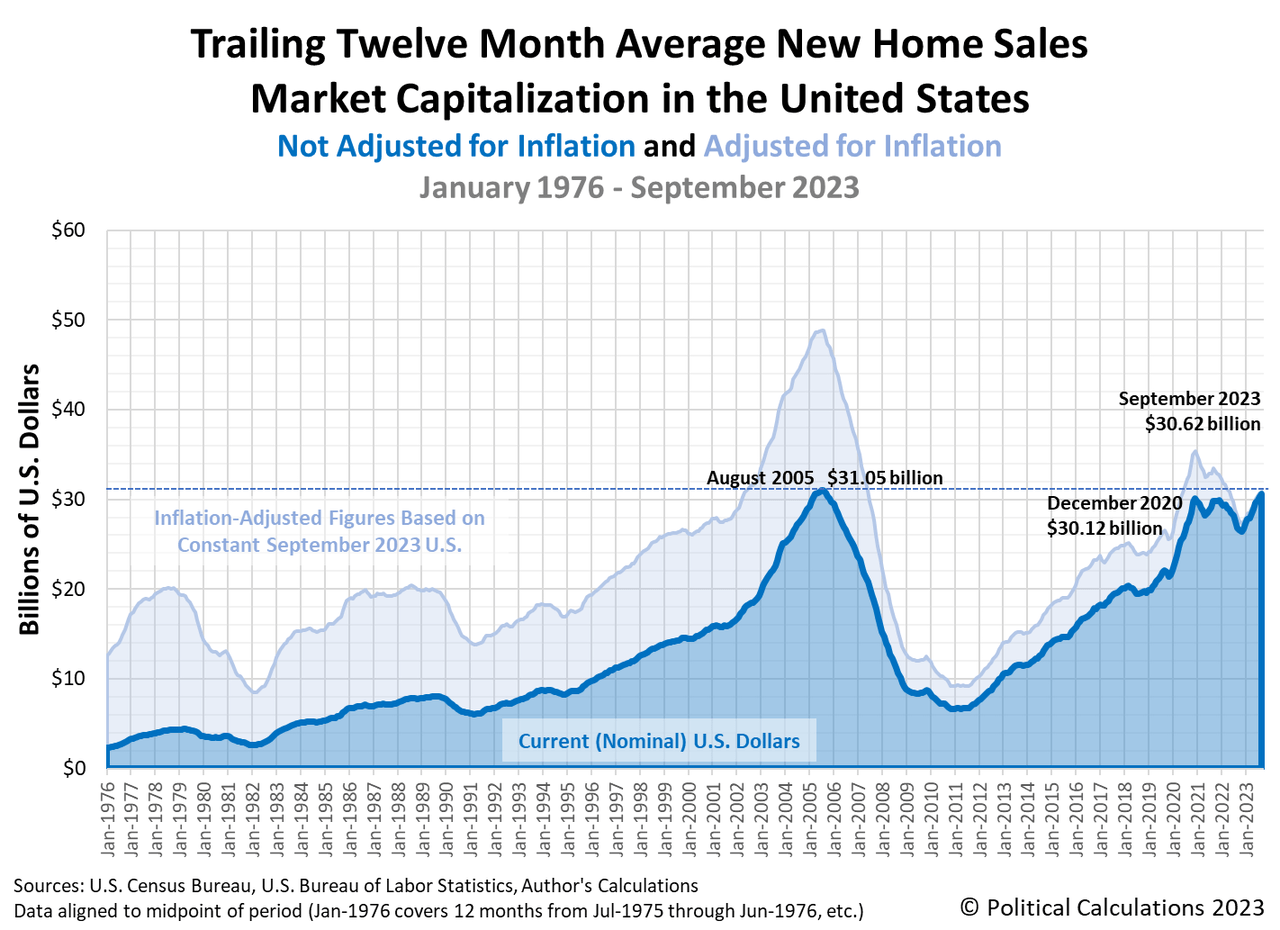
Political Calculations’ initial estimate of the market capitalization of new homes sold during the month of September 2023 is $30.62 billion. That figure is less than half a billion away from the nominal (non-inflation adjusted) peak of $31.05 billion that was reached in August 2005.
While this figure will be revised over the next several months, it continues a year-long trend for the non-inflation adjusted valuation of the number of new homes sold in the U.S. That trend coincides with a growing shortage of existing homes being put up for sale, which has boosted new home sales.
The underlying reason for the trend is the “golden handcuffs” scenario facing many existing home owners who purchased their homes at historically low mortgage rates, which had bottomed at 2.68% for a conventional 30-year fixed rate mortgage in December 2020. With today’s 30-year mortgage rates now touching 8.0% and the average new home still selling for over $500,000 despite declining since peaking a year earlier, many existing home owners simply cannot afford to sell their home and buy a new one.
Here is the latest update to our chart illustrating the market capitalization of the U.S. new home market since January 1976:

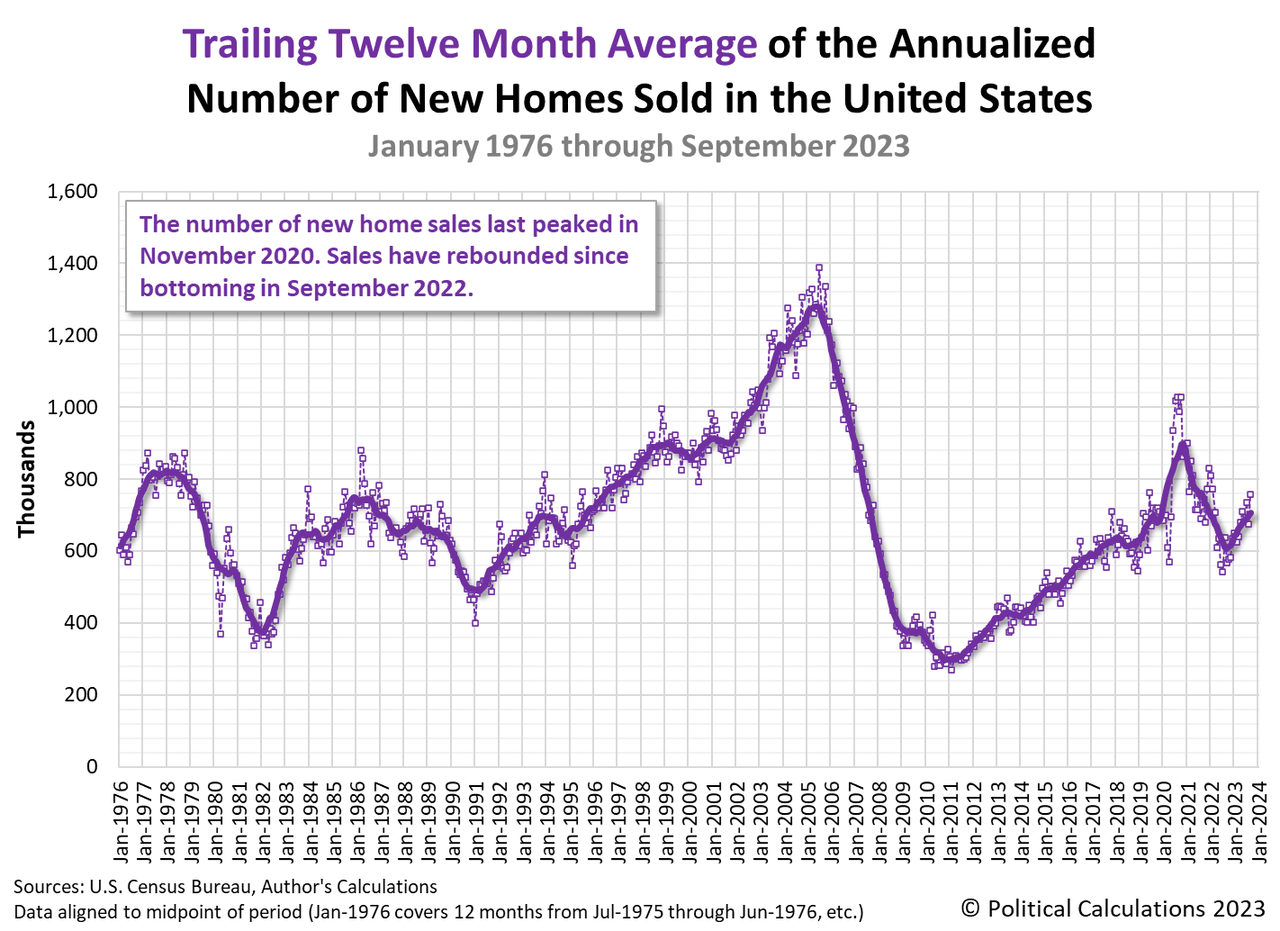
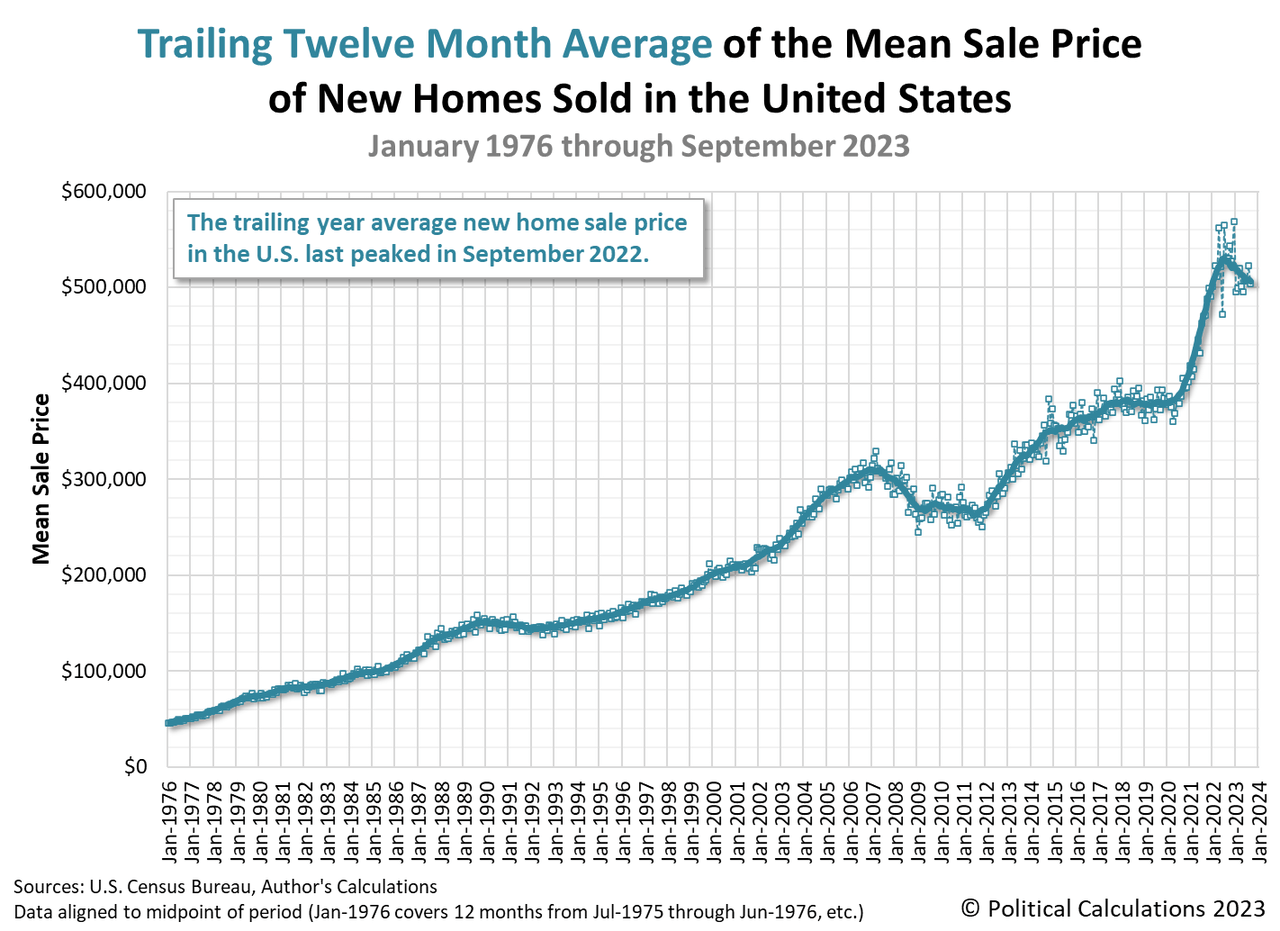
The next two charts show the latest changes in the trends for new home sales and prices:
A rising trend for new home sales:

New home prices trending downward:

While September 2023’s market cap is approaching the nominal, non-inflation adjusted peak from the housing bubble days of the early 2000s, it falls far below when inflation is taken into account. In terms of September 2023’s U.S. dollars, the housing bubble era peak is the equivalent of $48.8 billion. In real terms, today’s new home market is much smaller.
On the plus side for the U.S. economy, new home sales contribute roughly 3-5% to the nation’s Gross Domestic Product. The rising trend for the new home market cap has been contributing a tailwind to the U.S. economy since September 2022.
References
U.S. Census Bureau. New Residential Sales Historical Data. Houses Sold. [Excel Spreadsheet]. Accessed 26 September 2023.
U.S. Census Bureau. New Residential Sales Historical Data. Median and Average Sale Price of Houses Sold. [Excel Spreadsheet]. Accessed 26 September 2023.
Original Post
Editor’s Note: The summary bullets for this article were chosen by Seeking Alpha editors.
Read the full article here


