This year, the market has gone from euphoria to depression, from the triumph of the value-agnostic growth style amid the inflation-is-over narrative to a higher-for-longer story and a painful sell-off in bonds that is rippling through equities as well. No doubt, the environment has been exceedingly challenging to navigate. Hopefully, there are investment vehicles that have been doing relatively fine even amid this rollercoaster, with the Invesco S&P MidCap Quality ETF (NYSEARCA:XMHQ) being one of the examples.
In the previous article, when I assigned a Buy rating to XMHQ, I said that:
In light of the most recent CPI data that support the view that the economy is past the inflation zenith, I believe exposure to top-quality mid-cap stocks should be considered.
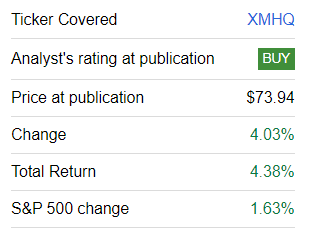
And even though the abating inflation narrative disappeared in the summer, XMHQ still outperformed the S&P 500 index since the note. As I pointed out in the article,
XMHQ demonstrated an ability to navigate different market narratives of the previous years, and I believe its factor mix is robust enough to deliver gains going forward.
To bring a bit more color, although it had a rather soft May, the vehicle nonetheless beat the iShares Core S&P 500 ETF (IVV) every single month from June to September.
Today, the following questions should be answered:
- How did the portfolio change in the wake of the June rebalancing?
- What were the key drivers of XMHQ’s outperformance?
- How has the factor story evolved?
- Does XMHQ still deserve a Buy rating?
Strategy essentials
Before we delve into the performance and factor intricacies, let us briefly review the fund’s strategy. To recap, its cornerstone is the S&P MidCap 400 Quality Index. According to the ETF’s website,
The Index is a modified market capitalization weighted index that holds approximately 80 securities in the S&P Midcap 400® Index that have the highest quality scores, which are computed based on a composite of three proprietary factors.
The index’s webpage clarifies that the said factors are Return on Equity, accruals ratio, and financial leverage.
It is also worth reminding that XMHQ changed its strategy in June 2019 (as its underlying index was replaced, the fund was renamed), so results delivered prior to that are irrelevant. They were ignored in the performance analysis section of the April article and will be ignored today.
Discussing the key contributors to outperformance
XMHQ’s underlying index is rebalanced twice a year. Since the previous article, it was rebalanced in June, with the next reshuffle due in December.
Seeking Alpha
As I have not been tracking the portfolio between April 11 and October 20, our options to check what holdings contribute most to outperformance are limited. So I decided to analyze how companies that retained their place in the portfolio performed over that period. But first, let us review what names were removed and added.
More specifically, I have found 30 new tickers in the dataset compared to April, accounting for 36.6% of the net assets. The following stocks are currently the heaviest in this group:
| Stock | Weight as of October 20 |
| Builders FirstSource (BLDR) | 3.7% |
| Reliance Steel & Aluminum (RS) | 2.7% |
| Southwestern Energy (SWN) | 2.3% |
| Carlisle Companies (CSL) | 2.3% |
| Watsco (WSO) | 2.1% |
Data from XMHQ
In the meantime, 31 companies were removed. Interestingly, Under Armour (UAA), which, despite having a weight of just about 33 bps, grossly contributed to the weighted-average EV/EBITDA back in April, is no longer in the portfolio.
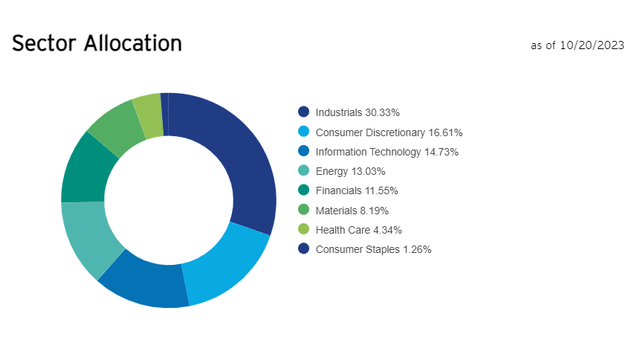
Sector exposures shifted a bit due to these adjustments. For example, the weight of industrials rose to 30.3% vs. 26.26% previously, while consumer discretionary lost approximately 3%, even though it retained its second position. The fund still has no footprint in the utilities and real estate sectors. Also, while one communication company was in the previous version, it has been removed.
Invesco
At the end of the day, 48 companies in XMHQ’s 80-strong portfolio retained their positions. And among them, there were a few notable contributors to the fund’s robust return, including the following main five outperformers:
| Stock | Sector | Weight (October 20) | Price return |
| Owens Corning (OC) | Industrials | 2.0% | 25.6% |
| Range Resources (RRC) | Energy | 2.4% | 26.4% |
| Williams-Sonoma (WSM) | Consumer Discretionary | 2.4% | 31.3% |
| Kinsale Capital Group (KNSL) | Financials | 1.6% | 34.1% |
| Jabil (JBL) | Information Technology | 3.1% | 49.4% |
Based on the comparison of the stock prices as of April 12 and October 23. Data from Seeking Alpha and the ETF
Unsurprisingly, every single energy stock that remained in the portfolio delivered gains, thus bolstering XMHQ’s return; the top name from the sector is the above-mentioned RRC; the smallest gain was delivered by Antero Resources (AR), 16.1%.
Nevertheless, certainly not all holdings were on a tear. I found out that 16 stocks were in the red, including the most significant detractors compiled below.
| Stock | Sector | Weight (October 20) | Price decline |
| Ashland (ASH) | Materials | 0.7% | -25.3% |
| Federated Hermes (FHI) | Financials | 0.5% | -25.1% |
| Genpact Limited (G) | Industrials | 1.0% | -22.0% |
| Olin (OLN) | Materials | 1.2% | -20.4% |
| Lattice Semiconductor (LSCC) | Information Technology | 2.4% | -19.6% |
Next, it is worth updating the annualized return analysis with the April-September 2023 data factored in. Funds selected for comparison are precisely the same as in the previous note, namely IVV, Invesco S&P 500 Quality ETF (SPHQ), SPDR® S&P MIDCAP 400® ETF Trust (MDY), and WisdomTree U.S. MidCap Earnings Fund ETF (EZM). The period concerned is July 2019-September 2023; as discussed above, it was shortened intentionally.
| Portfolio | XMHQ | IVV | MDY | EZM | SPHQ |
| Initial Balance | $10,000 | $10,000 | $10,000 | $10,000 | $10,000 |
| Final Balance | $16,956 | $15,653 | $13,536 | $13,568 | $16,119 |
| CAGR | 13.23% | 11.12% | 7.38% | 7.44% | 11.89% |
| Stdev | 20.75% | 18.67% | 22.32% | 25.38% | 17.76% |
| Best Year | 26.25% | 28.76% | 24.21% | 30.99% | 27.58% |
| Worst Year | -12.42% | -18.16% | -13.28% | -12.24% | -15.77% |
| Max. Drawdown | -22.81% | -23.93% | -29.63% | -36.80% | -24.33% |
| Sharpe Ratio | 0.62 | 0.57 | 0.36 | 0.35 | 0.63 |
| Sortino Ratio | 1.03 | 0.87 | 0.53 | 0.5 | 0.98 |
| Market Correlation | 0.94 | 1 | 0.94 | 0.91 | 0.97 |
Data from Portfolio Visualizer
Here, XMHQ is unrivaled. Neither IVV nor its mid-cap counterparts were capable of delivering a stronger CAGR. And even though the ETF was more volatile than IVV and SPHQ, it still clocked the highest risk-adjusted returns in the group (Sharpe and Sortino ratios). Also, its max drawdown was not that steep compared to other funds; even IVV fell much deeper, losing 23.93% during the 2022 bear market.
A fresh look at factors
After looking at the factor data, I should conclude that XMHQ remains a top-quality portfolio (even by large-cap echelon standards).
| Metric | Holdings as of April 11 | Holdings as of October 20 |
| Market Cap | $7.47 billion | $8.18 billion |
| EY | 11.1% | 10.46% |
| P/S | 3.96 | 3.14 |
| Fwd EPS | 10.4% | 11.28% |
| Fwd Revenue | 9% | 6.4% |
| ROE | 34.5% | 39.19% |
| ROA | 15% | 14.33% |
| EV/EBITDA | 22.8 | 14.1 |
| Quant Valuation grade B- or higher | 25.8% | 20.9% |
| Quant Profitability grade B- or higher | 96.2% | 92.5% |
Calculated by the author using data from Seeking Alpha and the fund
- For a mid-cap fund with a weighted-average market cap of around $8.18 billion, which has risen on the back of capital appreciation of the holdings, an earnings yield of 10.5% is fairly attractive, even though it has declined a bit since the previous analysis. For context, the EY is still more than 2x higher compared to the Schwab U.S. Mid-Cap ETF (SCHM), which I have covered earlier this October.
- EV/EBITDA has improved notably, now standing at 14.1x (with the financial sector removed from calculations). This is because UAA is no longer in the basket.
- The downside is that less than 21% have a Quant Valuation rating of B- or higher. This poses risks.
- Growth characteristics remain acceptable, even though a decline in the forward revenue growth rate was observed.
- Quality is close to excellent, with 92.5% having a B- Profitability rating or higher. ROE and ROA are robust as well.
Investor takeaway
In sum, XMHQ remains a top-quality mid-cap portfolio worth considering. The Buy rating is maintained. However, risks are aplenty even for a fund with a double-digit earnings yield and solid quality.
The largest issue is perhaps the ripple effects of persistently high oil prices, an issue that has been exacerbated by the war in Israel. This might result in the inflation problem becoming even more acute, thus translating into more challenges for regulators to bring it back to the 2% target.
Read the full article here


