Investment Thesis
Cars.com (NYSE:CARS) had a strong run post-COVID as improving car inventory levels and vehicle sales lead to an improvement in dealer spends. In addition, the company has done well in growing its value added services upselling/ cross selling to the dealers which drove about 50% growth within the average revenue per dealer. We believe the company is likely to report mid-single digit revenue growth and improving EBITDA margins going forward driven by pricing initiatives, higher ad spends by the dealers and growth in high margin value added services. We initiate at Buy ascribing a target price of $19 (at 9.3x EV/ EBITDA in line with its peer).
Company Background
Cars.com is a leading automotive marketplace platform connecting shoppers with dealers through its wide network of ~20k dealers (including franchised and independents) on its platforms with bulk of the dealers being franchised. It boasts about 26 mn monthly unique visitors on to its platform looking to browse through its 2.5 mn+ listings. In addition, it also provides additional services through its different brands such as Dealer Inspire (offering digital connected services to its dealers), FUEL (advertising solution for dealers and OEMs), CreditIQ (financing tools) and Accu-Trade (offering valuation and appraisal services)
Resilient Auto Sales
According to NADA, Total sales of new vehicles continue to remain strong driven by significant improvement in the inventory from domestic manufacturers compared to imports, however, average revenue per dealership dipped slightly but remains above significantly higher than pre-pandemic average. Consumers are more inclined to visit platforms such as Cars.com to get details on vehicle, comparisons with other cars, make and model, car reviews, dealer reviews and pricing which are critical in the overall purchasing decision.
NADA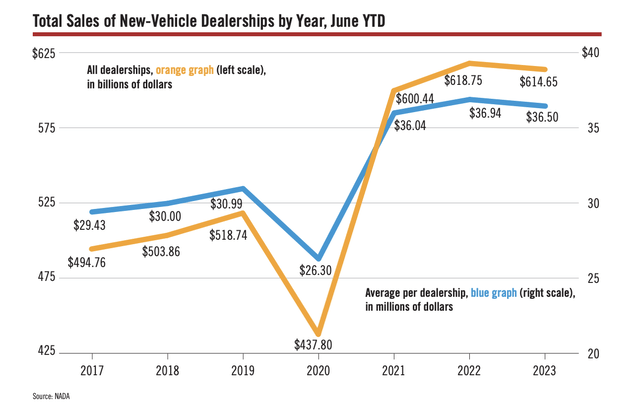
New Vehicle inventories improved significantly with about 2 mn units through June YTD 2023 compared to the 1 mn inventory as a result of easing supply chain with the semiconductor shortage issues ending last year. As the inventory levels increase, dealers are generally inclined to spend more on platforms to drive sales growth.
NADA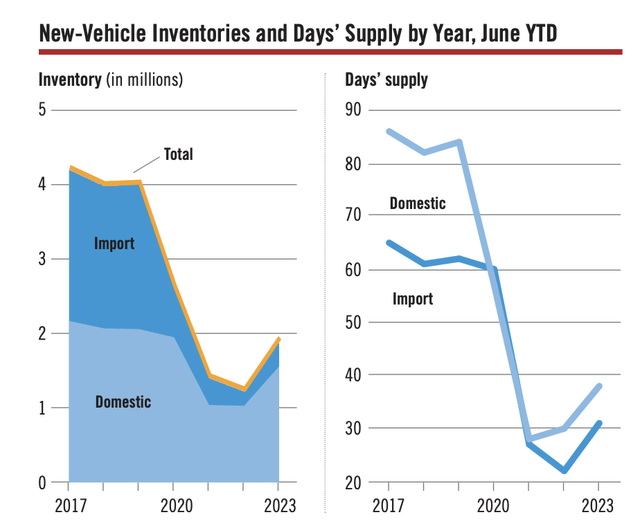
Used Vehicle sales also reported a steady demand, however, declined compared to previous years and still remains below pre-COVID levels as a result of a stronger growth in new car sales.
NADA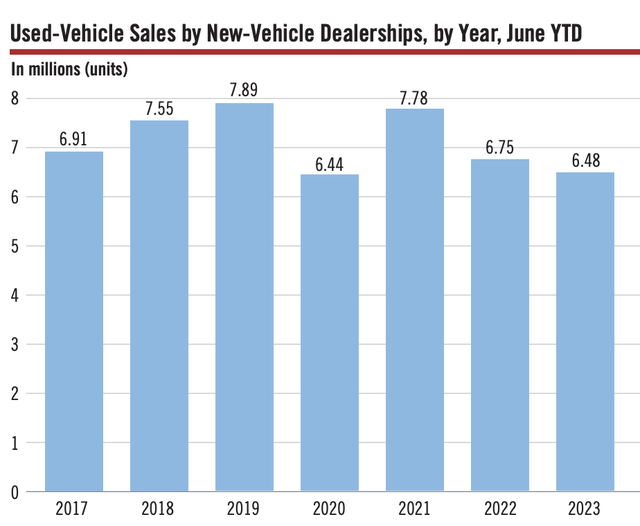
Total dealership advertising expenditure declined significantly in 2020 and still remains below the pre-covid levels, however, on a per unit basis, the advertising spend continues to be near 2022 highs at $692 and above the pre-covid levels of $655. Also, comparing the advertising spend per $ value of a vehicle comes to ~1.8% currently which is lower than ~2.2% during the pre-COVID days which provides further room for expansion.
NADA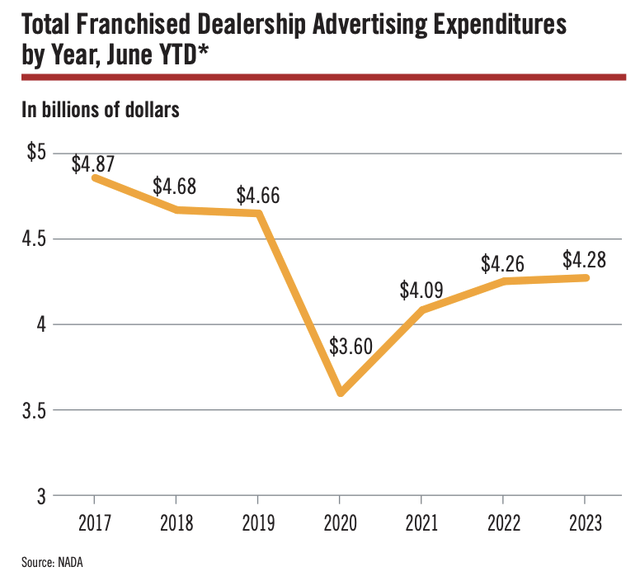
However, the ongoing UAW strikes against the three Detroit auto makers could potentially lead to production delays as well as can impair its ability to drive further pricing initiatives or maintain its pricing. Despite that, the three Detroit makers form about a third of the overall market and the targeted strikes can mean there could be limited impact on the auto production.
Historical Track Record
| ($ mn) | 2017 | 2018 | 2019 | 2020 | 2021 | 2022 |
| Dealer Revenue | 333 | 458 | 477 | 463 | 549 | 579 |
| OEM / National | 114 | 105 | 81 | 73 | 65 | 59 |
| Other | 179 | 99 | 49 | 11 | 9 | 16 |
| Tot. Revenue | 626 | 662 | 607 | 547 | 623 | 654 |
| EBITDA | 198 | 173 | 113 | 132 | 150 | 162 |
| % margin | 32% | 26% | 19% | 24% | 24% | 25% |
Note: Other includes wholesale revenue.
The company reported sustainable revenues and operating profits despite the impact of COVID which had led to a sharp decline in ad spends during the period. Wholesale revenues declined as the company continued to convert the affiliates to Direct mode in a bid to boost profitability. However, the company recovered well post the pandemic supported by resilient growth in dealers segment while OEM/ national spends continued to decline as a result of pullbacks in OEM spending as a result of supply chain issues and production delays.
Company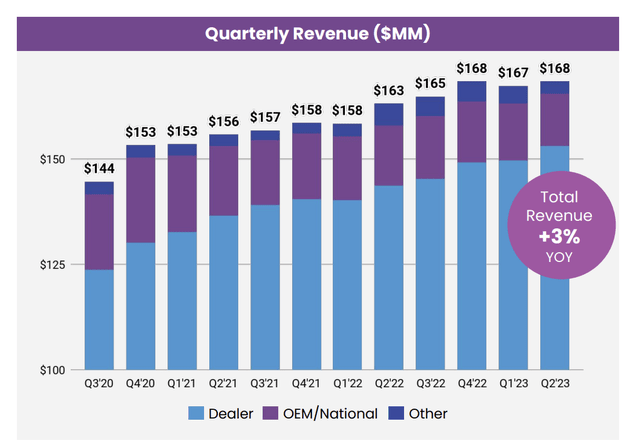
The company reported a decline in EBITDA margin as a result of ongoing investments in the Cars.com platform leading to higher marketing spends as well as higher product and technology costs driven by compensation and higher third party costs (licensing and consulting).
Growth Outlook
CARS boasts a large number of franchised dealers which forms the bulk of the dealership which sells both new and used cars and typically have more spending power than independent dealers. In the current environment with rising new car inventories and declining used car sales, we believe CARS will effectively leverage its strong platform and push price increases. The company has also started raising prices for ~70% of its dealers and had already completed the process for 80% of its target by July end (up from 60% at the end of Q2), its first price increase since the pandemic. It maintained that repricing in the quarter was back-end loaded which would entail the growth to be visible in Q3. The company has also done well in upselling/ cross selling of its value added services which had driven 50% of its 6.3% YoY growth in its Average Revenue per dealer. In addition, along with low single digit increase in overall volumes with incremental revenue from upselling and cross-selling of its products, in particular, Accu-trade, we believe the company is likely to achieve a mid-single digit growth.
In addition, from margins perspective, the company has been able to maintain gross margins of >80%. We believe given the recent pricing actions, the gross margins is likely to lead to about 100 bps jump which will enable them to post gross margins in line with their pre-COVID levels.
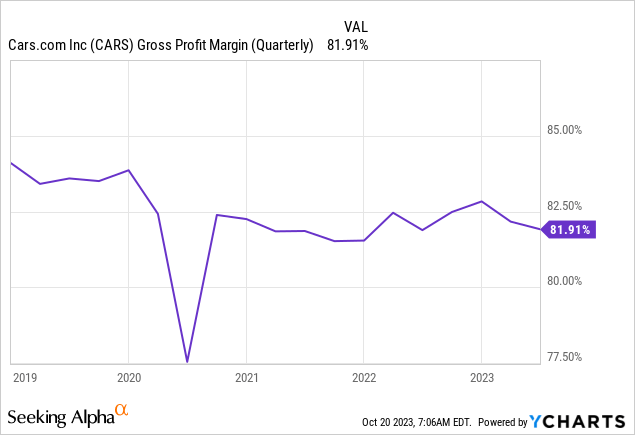
However, we believe the company would have to likely continue to invest within its own brand in order to attract customers will partially offset the expansion in gross margins and expect operating margins to expand by ~25 – 50 bps for 2024.
Valuation
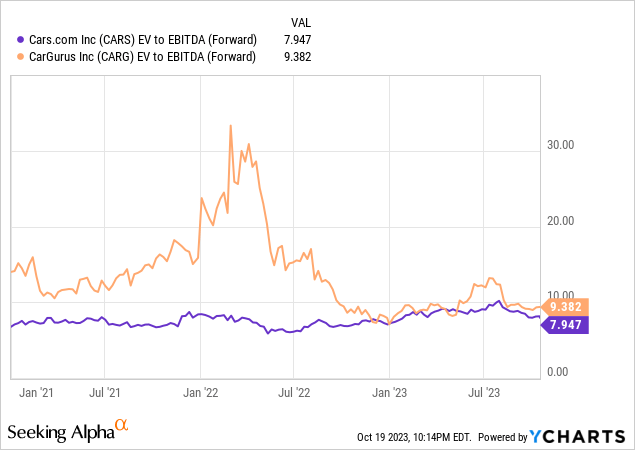
CARS trades at ~8x EV/ Fwd EBITDA compared to 9.4x EV/ Fwd EBITDA of CarGurus (CARG). This also compares to 8.4x EV/ EBITDA historical average that the company traded at in last 5 years. However, we believe, given the recent positive momentum in overall auto market driven by improving inventory position along with higher price realization and lower marketing spends due to strong organic growth entails a higher multiple compared to historical averages (which has been particularly depressed during COVID). We ascribe a 15% premium to its long term average as a result of better visibility in the near term cash generation ability and ascribe a target price of $19 (at 9.3x EV/ Fwd EBITDA which is also in line with its peer CarGurus). Initiate at Buy.
Risks to Rating
Risks to rating include
1) Economic downturn which can lead to a significant decline in consumer discretionary spends and lead to lower auto sales
2) Higher mortgage costs could lead to a declining purchase power and lead to lower volume sales
3) Any raw material or labor shortage as well as prolonged effect of the UAW strikes which has been ongoing for over a month can impact the supply chain and lead to a decline in vehicle manufacturing
4) Inability to drive monetization through upselling and/ or cross selling of products
Final Thoughts
Cars.com has done well post COVID and during last year as easing of supply chain issues led to a significant improvement in domestic inventory levels. This eventually helped them to post better revenue growth which remains above pre-COVID levels and improve its EBITDA margins which eventually drove the share price higher, up over 30% in the past year. The company also has flexible balance sheet with net leverage ratio of 2.3x which is comfortable and provides them the ability to improve driven by strong cash generation capacity. We believe the company is deeply embedded within the overall automotive system and poised to capitalize on the growth in ad spends by the dealers as a result of improving inventory and its exposure to franchised dealers who have deeper pockets. Initiate at Buy with target price of $19.
Read the full article here


