Celestica (NYSE:CLS) showcased a commendable financial performance in Q2 2023, registering a notable surge in revenue compared to Q2 2022. This upward trend was primarily driven by its main business segments. Moreover, key profitability metrics also witnessed favorable growth. This article delves into Celestica’s financial health and conducts a technical examination of its stock price to ascertain its future trajectory and potential investment avenues. Notably, the stock price appears to have established a robust upward trend, suggesting a higher valuation in the long run. However, the current price seems overbought, implying that market corrections could present valuable buying opportunities for long-term investors.
A Dive into Celestica’s Financial Health
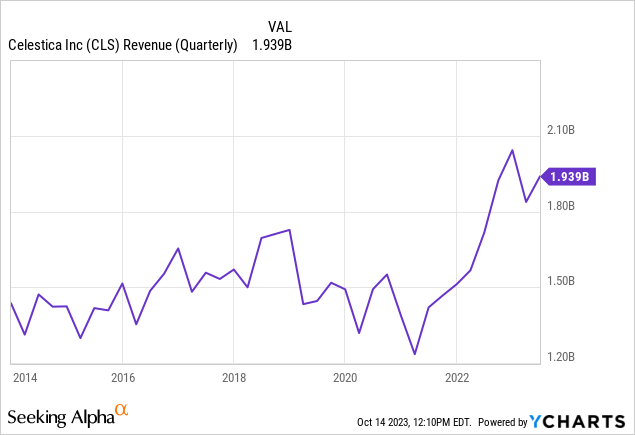
Celestica demonstrated a robust financial performance in Q2 2023, marking a significant uptrend compared to its performance in Q2 2022. The company’s revenue surged by 13%, at $1.939 billion, a notable jump from the $1.72 billion reported in Q2 2022. This growth was primarily propelled by its two main segments. The ATS segment witnessed a remarkable 24% revenue increase over the year, with its margin improving to 4.8% from 4.5%. This upswing was attributed to the strengthened industrial business and a recovery in commercial demand within the A&D business. On the other hand, the CCS segment reported a more modest 5% revenue growth, albeit with a margin uptick from 5.0% to 6.0%. However, HPS revenue for Q2 2023 declined by 23% year-over-year.
Regarding profitability, the non-IFRS operating margin exhibited a favorable rise, reaching 5.5% in contrast to 4.8% in Q2 2022. Similarly, the adjusted EPS experienced growth, increasing to $0.55 from $0.44 in Q2 2022. Furthermore, the company highlighted a substantial elevation in its adjusted return on invested capital at 20.0% compared to 16.2% in Q2 2022. The firm’s liquidity was also strengthened, with its adjusted free cash flow growing to $66.8 million from $43.3 million in Q2 2022.
Moreover, Celestica managed to navigate global supply chain constraints, primarily due to its advanced planning processes and collaborative efforts with customers and suppliers. Despite these headwinds, the company reported no significant adverse revenue impacts in Q2 2023, 1H 2023, or Q2 2022 because of these constraints. The following chart depicts the quarterly revenues over the last decade, highlighting a notable increase in 2022 and 2023.
Celestica has upgraded its 2023 forecast due to its strong Q2 results and expected demand. The firm now projects a revenue reaching at least $7.85 billion, a non-IFRS operating margin standing at 5.5%, a non-IFRS adjusted EPS of $2.25, and an adjusted free cash flow amounting to $125 million. If these figures come to fruition, they would signify an impressive 8% growth in revenue and an 18% jump in non-IFRS adjusted EPS relative to 2022. For 2024, Celestica is upbeat, anticipating revenue growth in all sectors. Based on its 2023 projections, they forecast a non-IFRS adjusted EPS increase of 10% or more. Celestica is set to release its Q3 2023 earnings on October 26, 2023, providing a clearer picture of the company’s financial well-being.
Long-Term Technical Development for Celestica
The stock price has demonstrated resilience in 2023, as evidenced by the following monthly chart. From 2003 to 2022, the stock established and confirmed a solid foundational base. However, a significant price decline occurred in 2001 and 2002 due to the dot-com bubble bursting that started in 2000. This market upheaval negatively affected many technology and electronics manufacturing firms. With the late 1990s market saturated with overvalued tech stocks fueled by undue optimism for internet-based businesses, a shift occurred when it was clear many of these companies lacked profitability. This led to diminished investor trust and a significant market pullback. Consequently, firms like Celestica faced decreased demand, reduced revenues, and stock value.
CLS Monthly Chart (stockcharts.com)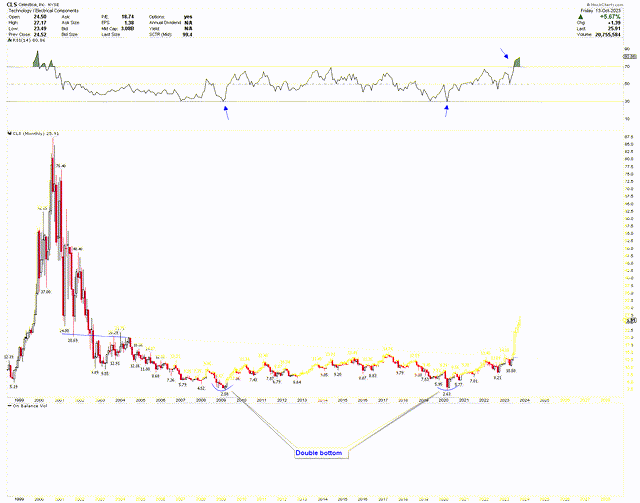
On a positive note, the consistent price stabilization between 2003 and 2022 signals positive momentum. A notable bullish trend is evident from the double bottom formation at $2.58 and $2.63, surpassing the neckline at around $14, with prices continuing to climb. This formation is underscored by blue arrows marking where the bottom took shape. The monthly candles from June to October 2023 have shown robust bullish movement, pushing the price to overbought territories suggesting a potential correction. The RSI further confirms this overbought condition.
For a deeper dive into these technical patterns, the subsequent weekly chart showcases the inverted head and shoulders, with the head at $2.63 and the shoulders at $5.95 and $5.77. This pattern breached the $14 mark, propelling the stock to loftier heights. Yet, the weekly chart also signals that the stock is presently in the overbought zone, hinting at the need for a correction. This sentiment is echoed by the RSI. Furthermore, the recent weekly candle formed a bearish hammer, signifying the potential onset of this correction.
CLS Weekly Chart (stockcharts.com)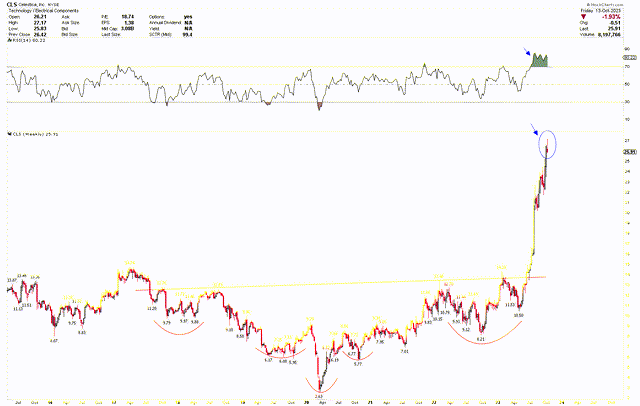
Pinpointing Crucial Levels and Investor Insights
Considering that the latest weekly candlestick displayed a bearish hammer, suggesting a possible price adjustment, the Fibonacci retracement levels calculated from the 2020 low of $2.63 to the all-time highs of $141.38 provide notable support zones. These levels are consistent with the long-term price trends discussed above. The initial robust support is pinpointed at the 38.2% Fibonacci retracement, which stands at $17.80, while the subsequent substantial support is found at the 50% retracement level, marked at $14.90. If the stock doesn’t exceed its record peak of $141.38, a decline to $17.80 might offer an attractive opportunity for long-term investors, considering its potential to serve as a robust support level.
CLS Weekly Chart (stockcharts.com)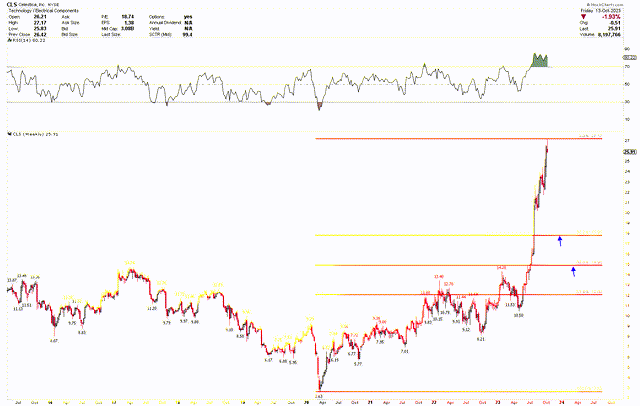
Risks
Celestica has so far adeptly navigated global supply chain constraints. However, continuous disruptions stemming from global logistics, geopolitical unrest, or other unforeseen challenges might jeopardize the company’s operations, especially if their strategic planning and collaborations with stakeholders don’t measure up. Additionally, given their commendable performance in Q2 2023, expectations are high for Celestica to achieve or surpass the year’s projections. Failure to do so could diminish investor trust and potentially depress the stock price.
From a technical perspective, Celestica’s stock appears overbought, hinting at a potential price correction. Investors should be cautious of this anticipated decline soon. Yet, it’s worth noting that the recent bearish hammer on the weekly chart seems subdued relative to the ongoing market volatility. If stock prices breach all-time highs, it could counteract the predicted correction, paving the way for further ascents.
Bottom Line
Celestica has posted an impressive financial performance in recent quarters, with a marked growth in revenue and profitability metrics compared to the previous year. Despite global supply chain challenges, the company has strategically maneuvered to avoid significant adverse impacts, a testament to its adept planning and collaborations. These accomplishments have set the stage for an optimistic forecast for the year ahead.
However, from the technical perspective, indicators suggest the potential for a price correction due to the stock being overbought. Support levels have been identified which could serve as entry points for investors. While the company’s track record and recent performance bode well, investors should remain vigilant of fundamental risks, like supply chain disruptions and technical indicators that point towards a potential price pullback. If the price drops to $17.80, investors may consider buying Celestica. Alternatively, buying becomes a viable option if the stock breaches its all-time highs.
Read the full article here


