Fundamentals
Fueled by a profoundly tragic geopolitical event from external forces, gold prices are poised to conclude this week near their highest levels since the summer. So, what has transpired during this week?
The predominant force influencing gold trading this week mirrors its impact on all financial asset classes and investing activities, transcending financial markets to become the most significant and sorrowful concern in the broader world. The eruption of what can only be described as a conflict marked by warfare and terror between Israel and Palestine over the past weekend immediately triggered a flight to safety in gold as global markets reopened for trading. This swift response propelled gold prices well beyond the $1850 per ounce mark by Monday evening.
Throughout the week, gold spot prices steadily ascended, occasionally swayed by the macroeconomic factors we typically monitor (which we will return to shortly). The headlines and distressing events unfolding in the Middle East continued to exert their influence. Additionally, a weakening US Dollar, a consequence of ongoing GOP gridlock and confusion as the US House of Representatives sought a new Speaker to enable the passage of critical budgetary measures, provided tailwinds to gold prices. Consequently, for most of the week, gold prices oscillated between $1870 and $1880 per ounce, often leaning closer to the latter figure.
On this Friday morning, there has been a vigorous and sharp acceleration in the rally of gold prices since the commencement of US trading. The price chart effortlessly breached what was anticipated to be sturdy, resistance at the $1900 level, ascending even higher. At lunchtime in New York, spot prices comfortably exceeded $1925 per ounce. This marks the highest bid/ask price for gold in almost a month, capping what appears to be the strongest single-week performance for this safe-haven commodity in seven months. While this sudden surge bears the typical hallmarks of a trader’s acute (over)reaction, it is likely more of a preemptive maneuver as managers and investors seek to reallocate their positions to the historical safe-haven role of gold. They do so with the understanding that there may be no respite in the Gaza conflict, especially over the weekend.
Assuming, as we must, that markets will persist after the Gaza conflict concludes (or, as has sadly become the case with the ongoing Russia-Ukraine conflict, it becomes “priced in” to markets), it is worthwhile to examine the macroeconomic indicators of the week and their impact on gold, or lack thereof. The release of meeting minutes and discussion notes from last month’s Federal Open Market Committee (FOMC) meeting revealed scant new information and mostly reinforced expectations of further rate hikes by the Federal Reserve this year and possibly in early 2024. Although the consensus projection for November’s FOMC decision may still be to maintain current rates, the market’s response to this information in gold trading and elsewhere was somewhat muddled by the Gaza headlines and the evolving Speaker of the House situation in Washington. In practice, Wednesday’s FOMC minutes did little to disrupt or accelerate the steady climb of the gold price chart.
More consequential was Thursday’s Consumer Price Index (CPI) report, which provided an update on consumer inflation in the US economy. The closely watched “core” inflation figure exhibited the anticipated modest year-over-year decrease, while the headline CPI figure showed a slightly higher reading than expected. While not a major setback for the Federal Reserve’s efforts to mitigate inflationary pressures, it did not present a new argument for the central bank to deviate from its current path of rate hikes. Traders, particularly in the US Treasury bond market, appeared to seize upon this perspective as yields surged once more, driving the yield on the 10-year Treasury Note to its highest level since 2007. In response, gold prices experienced their sole intraday decline of the week. This setback on Thursday shifted the starting point for Friday’s robust surge in gold prices from $1870 to $1880.
As emphasized here, the situation in Gaza unequivocally remains the primary driver of gold’s future trajectory. This is expected to become even more pronounced in the upcoming week, as the macroeconomic calendar offers limited counterprogramming. The focal point will largely be on public remarks from key FOMC officials, including Fed Chair Jerome Powell, as they address how the central bank anticipates the repercussions of a prolonged and inflamed Middle East conflict on financial conditions and, consequently, the monetary policy stance of the FOMC.
Let’s take a look at the standard deviation levels anticipated for next week’s trading and see where we can capture some profits.
Gold: Weekly Standard Deviation Report
Oct. 13, 2023 10:25 PM ET
Summary
- Bearish trend momentum in the gold futures market, but bullish price momentum.
- Traders advised to monitor key price levels and 9-day SMA for potential shifts.
- Upcoming cycle date on 10.15.23 should be considered in trading strategies.
gold weekly (TOS)
Introduction: This report presents an analysis of the gold futures market for the week, focusing on trend momentum, price momentum, price indicators, cycle analysis, and trading strategy recommendations.
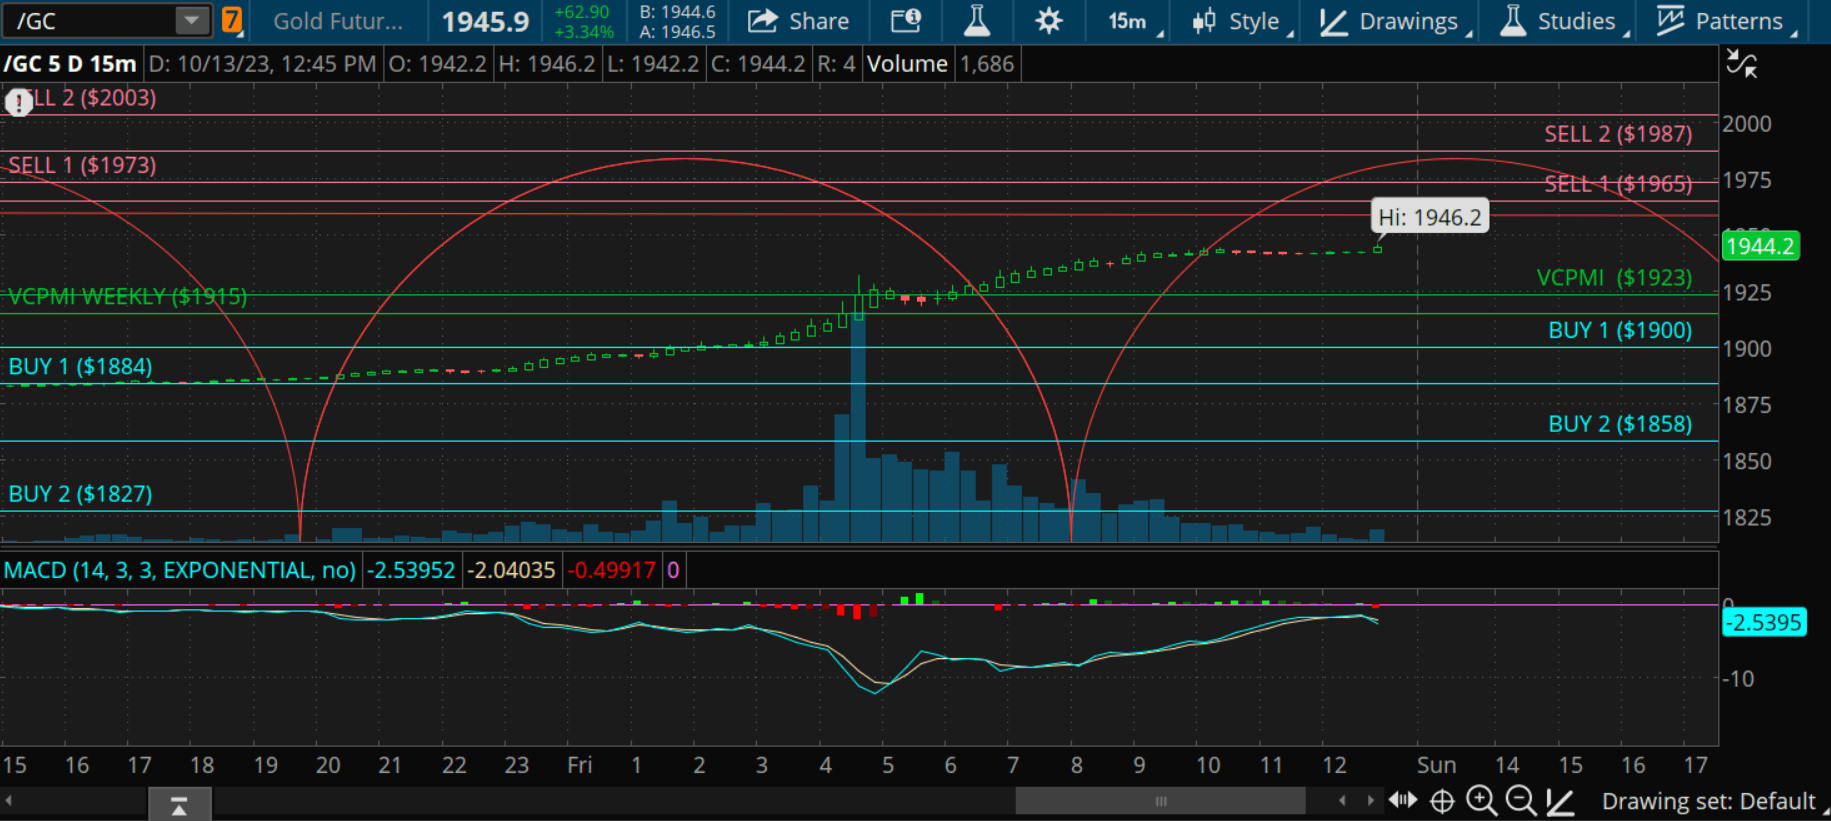
Weekly Trend Momentum: The gold futures contract closed at $1941.5, indicating the current market price. Notably, the market is trading above the 9-day Simple Moving Average (SMA) at $1923. This confirms a bearish weekly trend momentum. It’s imperative for traders to monitor the 9 SMA closely, as a close above it would negate the weekly bearish trend and shift it to neutral.
Weekly Price Momentum: The market closed above the VC Weekly Price Momentum Indicator at $1915, signaling bullish price momentum. A close below this indicator would change the weekly price momentum from bullish to neutral, potentially affecting trading decisions.
Weekly Price Indicator: For traders with short positions, it is advisable to consider taking profits during corrective phases, particularly at price levels ranging from $1884 to $1827. Conversely, traders looking to enter long positions should be vigilant for a weekly reversal stop signal. If currently in a long position, the $1827 price level can serve as a Monthly Stop Close Only and Good Till Cancelled order. Furthermore, it’s prudent to plan for profit-taking as the market approaches the $1973 – 2003 price levels during the month.
Cycle Analysis: The next cycle due date is identified as 10.15.23. This date should be incorporated into trading strategies as it may coincide with potential market shifts.
Trading Strategy Recommendation: For traders already in long positions, it is recommended to consider taking profits within the $1973 – $2003 price range. This range represents a potentially profitable exit point based on the current analysis.
Conclusion: In conclusion, the gold futures market is currently exhibiting bearish trend momentum but maintains bullish price momentum. Traders should closely monitor key price levels and the 9-day SMA for potential shifts in trend and momentum. The upcoming cycle date on 10.15.23 should also be considered when formulating trading strategies.
Disclaimer: The information in the Market Commentaries was obtained from sources believed to be reliable, but we do not guarantee its accuracy. Neither the information nor any opinion expressed herein constitutes a solicitation of the purchase or sale of any futures or options contracts. It is for educational purposes only.
Read the full article here


