Target Corporation (NYSE:TGT), owner and operator of Target, one of the largest retail chain stores in America, reported a 4.9% drop in sales last quarter. This headwind may mostly be reflective of changes in general consumer spending habits. Coming off of the Covid Pandemic of 2021, many Americans face financial strain, and have limited access to disposable income. As a result, Americans are spending less, instead of prioritizing spending on essential household goods. In fact, according to a recent survey, as many as 92% of Americans admit to “pulling back” on their spending. Like with many chain retail stores, this has negatively impacted Target, and they recorded their first drop in quarterly sales in 6 years. However, to combat this decline, Target has made some important announcements regarding their stores moving forward.
Target made splashes in the news by announcing new lines of affordable children’s toys. This well-timed announcement comes as we move into the Holiday season, a critical period for Target, where they’ll look to maximize consumer sales. This strategy will appeal to consumers with tight budgets, and will seek to bridge the gap between favorable consumer spending habits and current consumer disposable income. Additionally, this strategy represents a gesture of goodwill from Target to the general public, creating a good look for the Target Corporation brand.
Another headline Target received attention for recently was their decision to close 9 store locations in major cities across the United States. This announcement comes in response to the dramatic rise of retail theft and organized crime in recent years. Target now estimates a $1.3b profit loss from theft in 2023, representing a 160% increase from theft levels in 2022. With much of these losses coming from stores in population-dense cities, these strategic closures will help Target retain company merchandise, and in turn support company sales and revenue numbers.
While current news stories, good or bad can sway our opinion about investing in a company, it’s good to analyze the fundamentals of the company and to see where it’s been in the past and in which direction it’s heading.
This article will focus on the long-term fundamentals of the company, which tend to give us a better picture of the company as a viable investment. I also analyze the value of the company versus the price and help you to determine if TGT is currently trading at a bargain price. I provide various situations which help estimate the company’s future returns. In closing, I will tell you my personal opinion about whether I’m interested in taking a position in this company and why.
Snapshot of the Company
A fast way for me to get an overall understanding of the condition of the business is to use the BTMA Stock Analyzer’s company rating score. TGT currently has an impressive company rating score of 83.5 out of 100.
Before jumping to conclusions, we’ll have to look closer into individual categories to see what’s going on.
BTMA Stock Analyzer
Fundamentals
Let’s examine the price per share history first. In the chart below, we can see that price per share has shown significant, steady growth over many years, before finally decreasing over the last 2 years. It’s important to note, even with the decline shown from 2021-2023, price per share is still recorded at high levels. Overall, share price average has grown by about 205.32% over the past 10 years, or a Compound Annual Growth Rate (CAGR) of 13.20%. This is a very good return.
BTMA Stock Analyzer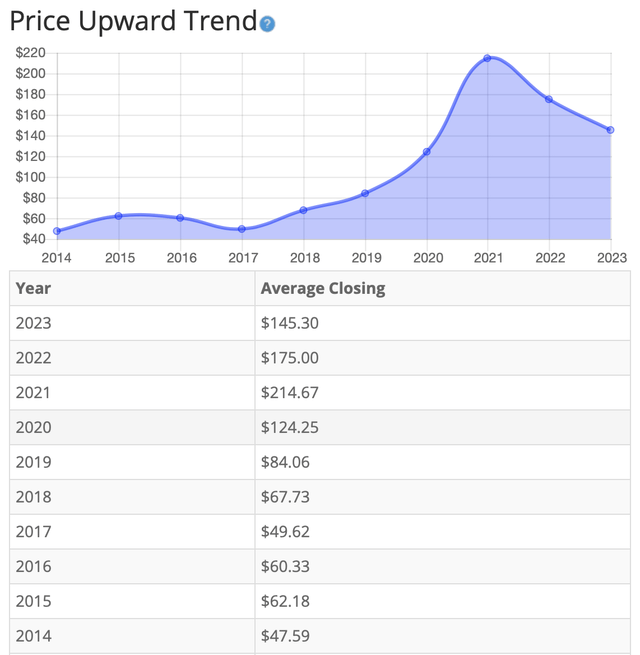
Earnings
Looking closer at earnings history, we see earnings were consistently increasing from 2017 to 2022. However, other years have shown volatility.
The years of sudden increase and decrease do not come as a surprise. In fact, given the topics touched on earlier in this article, earnings numbers have reacted predictably. Both the dramatic rise and fall can most likely be attributed to factors created by the COVID-19 pandemic. As the pandemic started in 2020, governments issued stimulus checks to help boost the economy and supplement household income. This additional income, paired with extra time spent at home, created a boom in retail stores sales and revenue. Since then, rebounding from the pandemic has proved hard for many Americans, and consumer spending habits reflect this hardship. In this case, when consumer spending declines, so does Target’s earnings, as shown by the sharp decrease from 2022-2023. In total, it’s quite likely Target’s earnings are still affected by the COVID-19 pandemic and the general state of the United States economy.
Consistent earnings make it easier to accurately estimate the future growth and value of the company. So, in this regard, TGT does not provide a clear picture to follow moving forward.
BTMA Stock Analyzer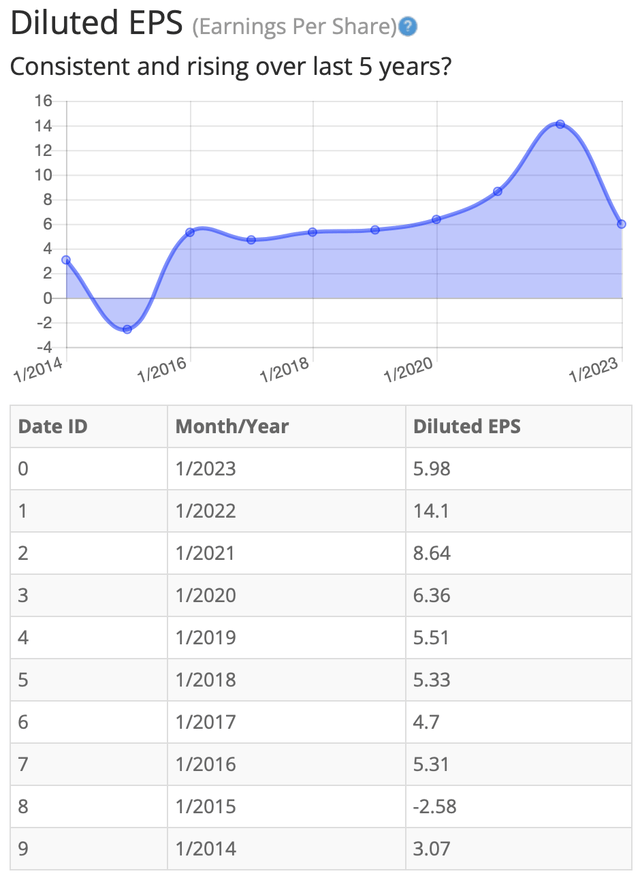
Since earnings and price per share don’t always give the whole picture, it’s good to look at other factors like the gross margins, return on equity, and return on invested capital.
Return on Equity
Return on equity has decreased considerably in the period from 2022 to 2023. Beginning a downward trend in 2022, ROE has quickly entered a free fall. Their latest numbers from 2022 reflect approximately a -27.00% decrease in ROE. It’s worth noting, however, that because of a large spike going into 2022, TGT’s 5-year average is still high. For return on equity (ROE), I look for a 5-year average of 16% or more. TGT’s ROE is nearly double this requirement, boasting a 5-year average of 32.24%.
BTMA Stock Analyzer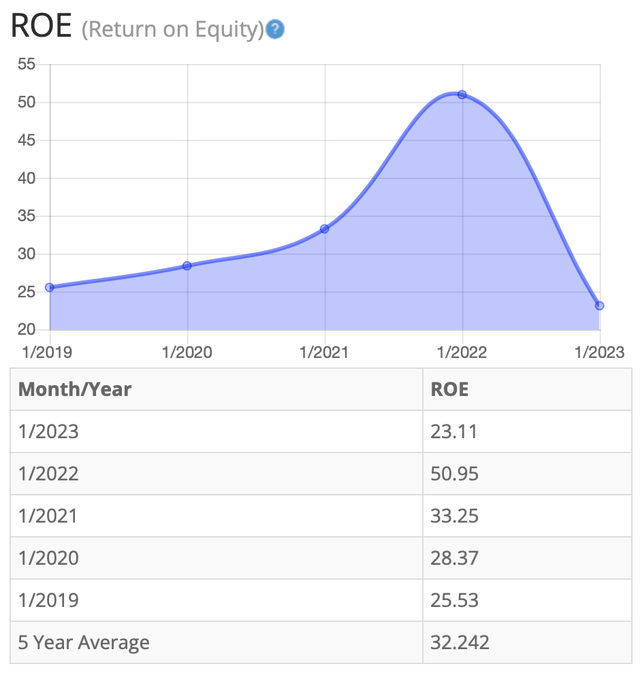
Let’s compare the ROE of this company to its industry. The average ROE measured across 15 general retail companies is 18.29%
Therefore, both TGT’s 5-year average ROE of 32.34%, and current ROE of 23.11%, are well above average.
Return on Invested Capital
TGT’s Return on Invested Capital (ROIC) has mirrored ROE trends. ROIC peaked in 2022, before sharply dropping the following year. TGT’s most recent update reflects this, officially reporting a ROIC decline of nearly 14% from 2022-2023. For return on invested capital (ROIC), I also look for a 5-year average of 16% or more. Therefore, TGT’s 16.42% average meets this requirement.
BTMA Stock Analyzer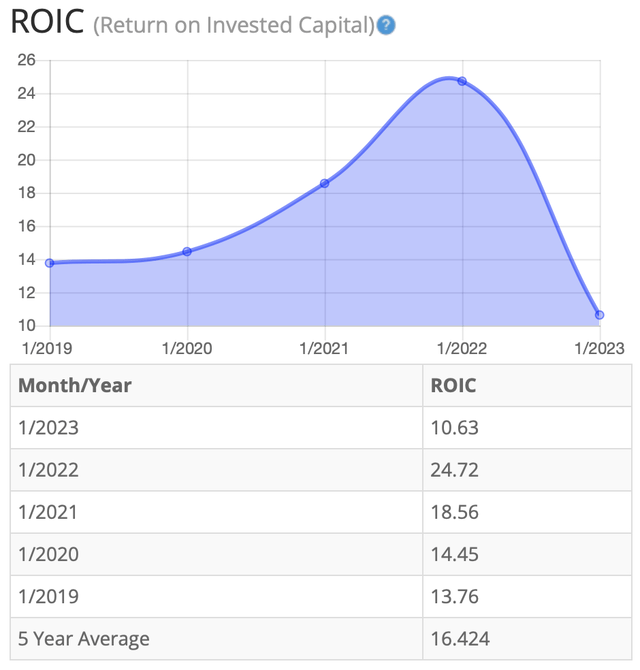
Gross Margin Percent
The gross margin percent (GMP) has seen little fluctuation until recently, dropping off steeply from 2022-2023. Five-year GMP average is maintaining around 28%. I typically look for companies with gross margin percent consistently above 30%. So, while GMP is still at respectable levels, it falls just short of my preference.
BTMA Stock Analyzer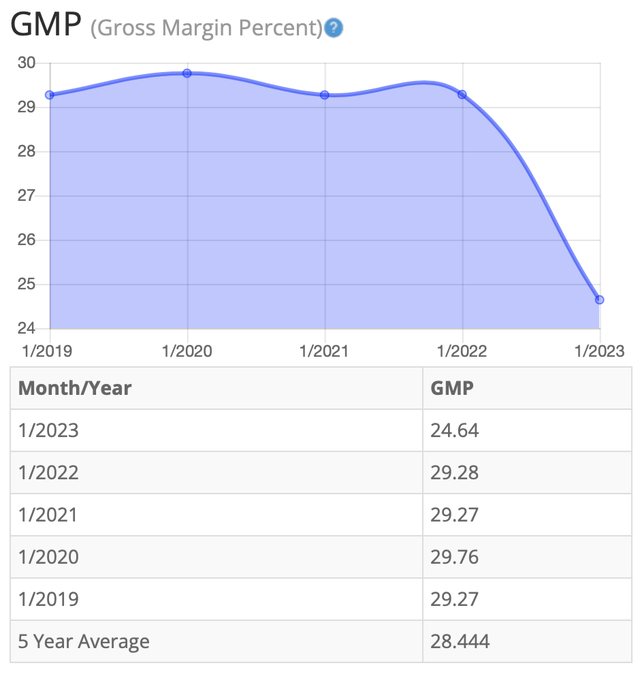
Financial Stability
Looking at other fundamentals involving the balance sheet, we can see that the debt-to-equity is greater than 1. This is a negative indicator, telling us that the company owes more than it owns.
TGT’s Current Ratio of 0.92 is below target levels as well, indicating a potentially poor ability to use its current assets to pay its short-term debt.
Ideally, we’d want to see a Current Ratio of more than 1, so TGT falls short of this amount.
According to the balance sheet, the company needs to improve its financial health. In the long term, the company should try to decrease its debt obligations. In the short-term the company may not be generating enough cash flow to fulfill its obligations.
TGT currently pays a dividend yield of 4.07%.
BTMA Stock Analyzer
This analysis wouldn’t be complete without considering the value of the company vs. share price.
Value Vs. Price
The company’s Price-Earnings Ratio of 28.24 indicates that Target Corp. might be overpriced when comparing Target’s current PE Ratio to a long-term market average PE Ratio of 15.
The 10-year and 5-year average PE Ratio of TGT has typically been 18.0 and 17.2, respectively. This also indicates that TGT could be currently trading at a high price when comparing to its average historical PE Ratio range.
BTMA Stock Analyzer
The Intrinsic Value and Estimated Value of the Stock show a valuation range of $67 – $116.88, versus the current stock price of $105.15. This indicates that TGT’s price is within this valuation range, but the stock could be slightly overpriced.
For more detailed valuation purposes, I will be using a diluted EPS of 5.98. I’ve used various past averages of growth rates and PE Ratios to calculate different scenarios of valuation ranges from low to average values. The valuations compare growth rates of EPS, Book Value, and Total Equity.
In the table below, you can see the different scenarios, and in the chart, you will see vertical valuation lines that correspond to the table valuation ranges. The dots on the lines represent the current stock price. If the dot is towards the bottom of the valuation range, this would indicate that the stock is undervalued. If the dot is near the top of the valuation line, this would show an overvalued stock.
BTMA Wealth Builders Club BTMA Wealth Builders Club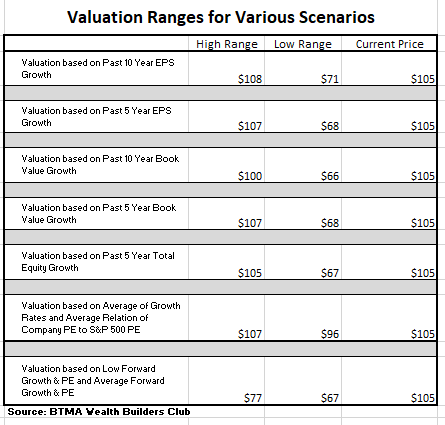
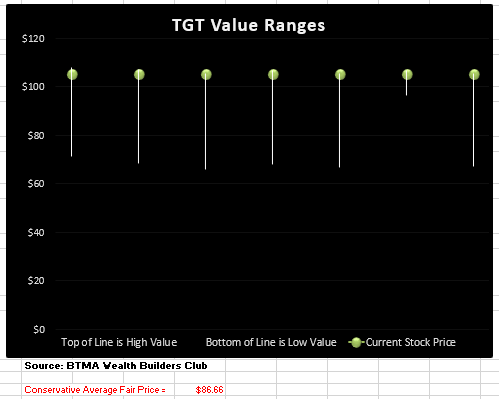
This analysis shows an average valuation of around $86 per share versus its current price of about $105, this would indicate that TGT is overpriced.
Summarizing the Fundamentals
According to the facts, Target could use improvement in terms of not having enough equity as compared with debt. In the short-term, the current ratio indicates that it does not have enough cash to cover current liabilities.
However, while TGT’s financials may not be at ideal levels, it needs to be considered that although TGT recorded a decline in sales this past quarter, it was their first reported decline in 6 years. Already implementing strategies to improve sales and retain earnings, TGT is projected to rebound within the next year. In the meantime, TGT can lean on the established, household name brand they’ve created to weather current headwinds they’re facing in the short term.
In terms of valuation, my analysis shows that the stock is overpriced.
TGT Vs. The S&P 500
Now, let’s see how TGT compares versus the US stock market benchmark S&P 500 over the past 10 years. From the chart below, we can see that for a majority of years, TGT produced similar or worse results than the S&P 500. Then as a result of the retail boom caused by COVID, the stock surged. These COVID years are outliers. Therefore, I will put more focus on the “normal years” prior to COVID. These years clearly show us that Target has underperformed the market benchmark in most normal years.
Morningstar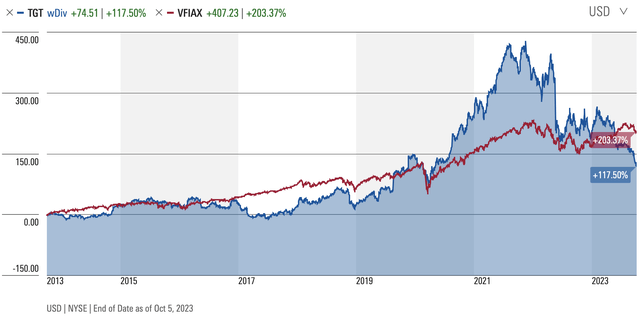
Forward-Looking Conclusion
Over the next five years, the analysts that follow this company are expecting it to grow earnings at an average annual rate of 14.2%.
In addition, the average one-year price target for this stock is at $149.41 which is about a 42.09% increase in a year.
The Expected Annual Compounding Rate of Return is 0.66%.
If considering actual past results of Target Corp., the story is a bit different. Here are the actual 10 and 5-year return results.
______________
10 Year Return Results if Invested in TGT:
Initial Investment Date: 10/7/2013
End Date: 10/7/2023
Cost per Share: $62.68
End Date Price: $105.01
Total Dividends Received: $27.43
Total Return: 111.30%
Compound Annualized Growth Rate: 8%
_______________
5 Year Return Results if Invested in TGT:
Initial Investment Date: 10/7/2018
End Date: 10/7/2023
Cost per Share: $84.52
End Date Price: $105.01
Total Dividends Received: $16.30
Total Return: 43.53%
Compound Annualized Growth Rate: 8%
_________________
From these scenarios, we have produced results of 8%. I feel that if you’re a long-term patient investor and believer in Target, and its trendy retail stores, you could expect TGT to provide you with around 8% annual return over the long haul.
As a comparison, the S&P 500’s average return from 1928 – 2014 is about 10%. So, in a typical scenario with TGT, you could expect to earn a lower long-term return as compared with an S&P 500 index fund. Another drawback is that the individual Target stock obviously doesn’t offer the diversification that the index fund does.
Does TGT Pass My Checklist?
- Company Rating 70+ out of 100? YES (83.5)
- Share Price Compound Annual Growth Rate > 12%? YES (13.2%)
- Earnings history mostly increasing? YES
- ROE (5-year average 16% or greater)? YES (32.2%)
- ROIC (5-year average 16% or greater)? YES (16.4%)
- Gross Margin % (5-year average > 30%)? NO (28.4%)
- Debt-to-Equity (less than 1)? NO (1.70)
- Current Ratio (greater than 1)? NO (0.92)
- Outperformed S&P 500 during most of the past 10 years? NO
- Do I think this company will continue to successfully sell their same main product/service for the next 10 years? YES
TGT scored 6/10 or 60%. Therefore, TGT might not be the best investment at this time.
Is TGT Currently Selling at a Bargain Price?
- Price Earnings less than 16? NO (28.2)
- Valuation Analysis greater than Current Stock Price? NO (Value $86 < $105.15 Stock Price)
In conclusion, Target has been a steadily growing company in the past. COVID has shaken things up and caused volatility in the earnings and other fundamentals. Additional headwinds are affecting the retail business and Target, specifically. The current price does not entice me to consider a position at this time. The price is too high, the fundamentals need to improve, and the stock offers less diversification and more risk than investing in an S&P 500 index fund. It boils down to a simple case of more risk than reward.
Read the full article here


