In case you missed it, I recently wrote an article titled Emotions Determine Market Price (In The Short Run) and as I explained, “emotions play a significant role in investing and should not be ignored or downplayed”.
Most intelligent investors know that “controlling emotions can lead to better investment decisions and increased profitability”.
If you have been an investor long enough you know exactly what this means, and in that article I highlighted a few REITs that are textbook examples highlighting the importance of understanding emotions in the stock market.
While emotions do play a role in the investing process, the critical element to understand is that, at the end of the day, earnings determine market price over the longer run.
That’s why my friend Chuck Carnevale refers to “earnings as the bottom line”.
As Chuck explains, “at the heart of my thesis, is the real-world reality that the “stock market” values a business by capitalizing the company’s earnings power in the long run.”
I’ve known Chuck for over 13 years and he’s mentored me to grasp the concept of “earnings determine market price over the long run”. He said that
“whether people are doing it consciously or subconsciously, most rhetoric you will find by investors discussing their favorite, or least favorite stock, will relate to their expectations of the business’ earnings power.”
They may not state this directly, but if you read between the lines, it becomes readily noticeable that the company’s earnings power is what is on their minds.
Now keep in mind there are dozens of earnings formulas to be considered and one of the most common is cash flows.
Alternatively, Warren Buffett has often stated that he believed the value of the company was simply the total of the net owner earnings expected to occur over the life of the business.
To Warren Buffett, owner earnings are calculated after taking out numerous accounting adjustments such as depreciation, depletion, amortization, and other non-cash charges, etc. He feels that his definition of owner earnings is preferable to GAAP.
Owner earnings = Net income + Depreciation and Amortization – Capital expenditures
Of course, for Real Estate Investment Trusts (REITs) there’s a unique way to measure increases in a REIT’s value and evaluate streams of income and cash flows such as funds from operations, or FFO.
Specifically, for REITs earnings per share (‘EPS’) are of little value since real estate earnings are generally weighed down by depreciation costs that are non-cash in nature and don’t reflect asset value changes.
Understanding REIT Earnings Metrics
For a REIT, net income is simply less meaningful as a measure of profitability.
In accounting, real estate depreciation is always treated as an expense. Yet, in the real world, real estate appreciates in value as long as it’s in a good location and well-managed.
That’s why when a REIT’s net income under GAAP reflects a large depreciation expense… it’s meaningless as a measure of cash flow. You have to add back real estate depreciation into the equation to make it matter.
There are other adjustments that should be made, too.
For instance, subtracting from GAAP net income any capital gain income recorded from the sale of properties. Also, GAAP net income is normally determined after “straight-lining” contractual rental income over the term of the lease.
However, since rents normally increase, adjustments should be made when examining FFO to reflect the actual contractual rental revenue received during the reporting period.
To address this shortcoming, FFO was adopted by the National Association of Real Estate Investment Trusts (Nareit) in 1991. It was then formally accepted as a reportable financial term by the SEC in 2003.
Computing FFO is simple:
FFO = Net Income + Depreciation + Amortization – Gains on Sales of Property.
Upon its adoption, FFO multiples (rather than earnings multiples) quickly became the yardstick for comparative REIT valuations. As previously described, this makes sense.
However, it still has definite shortcomings because some non-cash and seldom-occurring items must be removed from the earnings equation to arrive at the correct conclusion.
In that regard, FFO is rather like a proxy for recurring cash flow that can be used to support dividend payments.
Get to Know AFFO
Recognizing this, many analysts and some companies began to report “adjusted funds from operations” (AFFO). The biggest change this makes to FFO is subtracting recurring capital expenditures, also known as capex.
Basically, this is an acknowledgment that not all depreciation is non-cash.
If you’re a landlord, you can generally expect to be called upon to make improvements to your real estate each time you sign up a new tenant.
Those tenant improvements will generally suffice for the duration of the lease term, but signing up a tenant for a lease renewal will likely also require an added tenant improvements allowance.
So, the question is this: How much do real estate companies have to shell out every year to retain their portfolio quality and tenant occupancy levels? AFFO tries to factor that in.
With that said, there’s more to AFFO than just recurring capex. For instance, straight-lined rents are a beauty.
Since AFFO is designed to be a closer proxy for actual normalized cash flows per share, a common calculation of AFFO might appear as follows:
AFFO = FFO – Straight-Lined Rents – Recurring Capital Expenditure (‘CAPEX’) + Equity-Based Compensation + Lease Intangibles + Deferred Financing Cost.
The term “lease intangibles” started to appear around 2004 and is supposed to reflect the cost of procuring tenants. Prior to that, those considerations were simply chalked up to part of the valuation process.
So, adding this non-cash number into AFFO generally makes sense because such costs are never reflected in any MAI (member of the Appraisal Institute) appraisal.
Deferred financing costs are also non-cash factors, just if any fees associated with bank or bond financing are paid upfront and then subject to non-cash expenses later. But really, this is all about timing. There’s a clear cash component that reoccurs here as bonds and banknotes mature and are replaced.
Equity-based compensation is also non-cash, but the dividends allocated to that newly issued equity are not. In addition to the adjustments to FFO in the AFFO formula above, some companies may periodically include other items if they believe it will help shareholders arrive at a normalized number more reflective of corporate recurring cash flows.
With all of that said, you need to know that AFFO isn’t sanctioned by the SEC. Therefore, it isn’t always consistently reported. Plus, not all analysts view it the same, so some make their own adjustments to it. That said, AFFO disclosure is very helpful to determine a company’s high-level estimate of normalized cash flow per share.
REITs for Dummies by Brad Thomas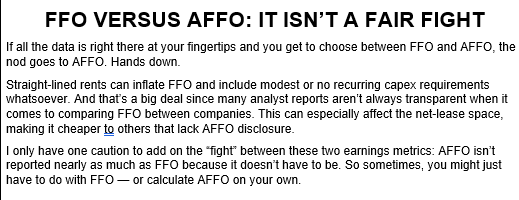
Now that we’ve cleared up the appropriate earnings metrics for REITs, let me tell you about two textbook examples of REITs that demonstrate a pattern of repeatability.
You may recall my first article in the series – Emotions Determine Market Price (In The Short Run) – in which I laid out 3 REITs that have exemplified extreme volatility thanks in large part to their earnings decline and dividend cut this year.
Now, we move on to a textbook example of what Chuck Carnevale refers to as EDMP: Earnings Determine Market Price (in the Long Run). I’m a disciple of Chuck’s teaching which is also why he’s called Mr. Valuation.
Mid-America Apartment (MAA)
MAA is an apartment REIT that owns 276 communities (95,000+ units) in some of the top Sunbelt markets such as Atlanta, Dallas, Tampa, Orlando, Charlotte, Austin, Raleigh-Durham, Nashville, Houston, and Charleston. The large majority of these properties are considered A+/A (39%) or A-/B+ (53%) and most are garden style (62%) or mid-rise (34%).
MAA has been public for 29 years and during this time the company has done a terrific job of generating reliable and predictable earnings. The key to that success has been the disciplined capital markets execution that consists of a fortress A3/A- rated balance sheet and 118 consecutive quarterly cash dividends since the IPO.
As shown below, even during the Great Recession, MAA was able to generate earnings (AFFO per share) growth, and from 2007 to 2023, the company generated CAGR of 7.0%.
iREIT®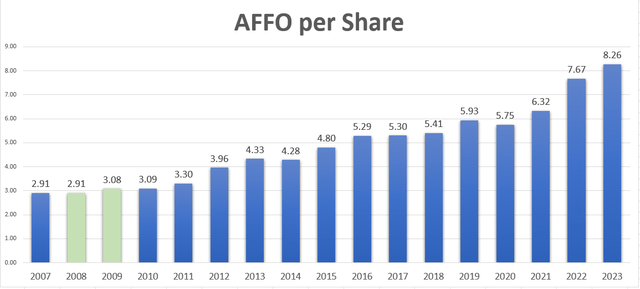
And based on analyst estimates, MAA is forecasted to grow by over 5% in 2024 and 2024:
iREIT®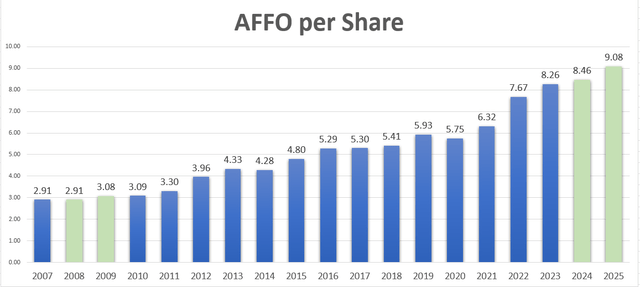
Although MAA did not increase the dividend during the Great Recession, it didn’t cut it. Also, as shown below, MAA had a sizeable boost to the dividend in 2023, and there appears to be no slowing down based on the solid payout ratio of just 68%.
iREIT®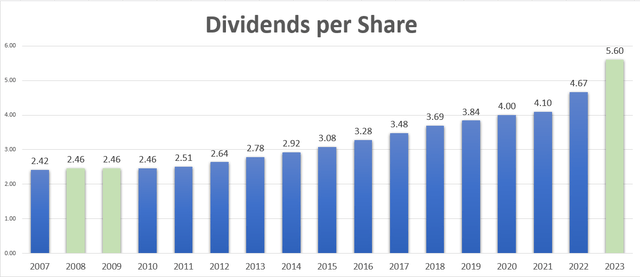
Like all REITs, MAA has become cheaper based upon its P/AFFO of 16.1 compared with the normal multiple of 18.6x. Even factoring out the COVID-19 euphoria pricing, MAA has traded in the low 18x range.
The dividend yield is now 4.3%, which makes for an excellent entry price given the potential for price appreciation.
Given the highly predictable earnings (past, present, and future) we consider MAA a terrific buy right now that could return over 20% annually.
FAST Graphs 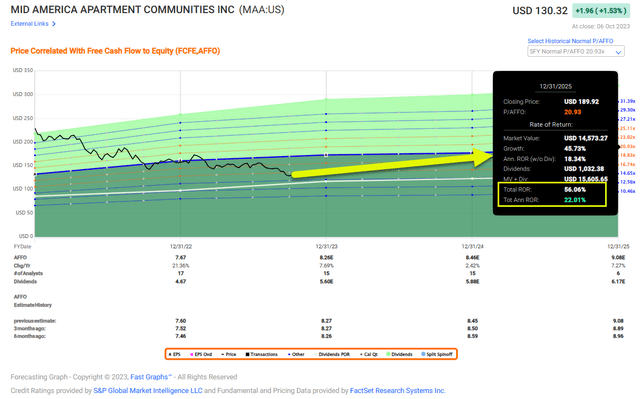
Realty Income (O)
O owns over 13,100 real estate properties primarily owned under long-term net lease agreements with commercial clients. The portfolio is well diversified with over 1,300 clients in 85 industries spread across all 50 states, Puerto Rico, Ireland, Italy, Spain, and the U.K.
O collects over $3.8 Billion in annualized rent of which 40% is from investment grade clients.
Much like MAA, O has a fortress balance sheet rated A3/A- which is another indicator that the stalwart net lease REIT maintains steady capital markets discipline. The earnings profile is quite impressive with 26 out of 27 years of growth (based on AFFO per share). Moreso, O was one of just four retail REITs with positive growth in 2020 and one of seven S&P 500 REITs to do so.
As shown below, even during the Great Recession O’s earnings (AFFO per share) declined, and from 2007 to 2023 the company generated CAGR of 5.1%.
iREIT®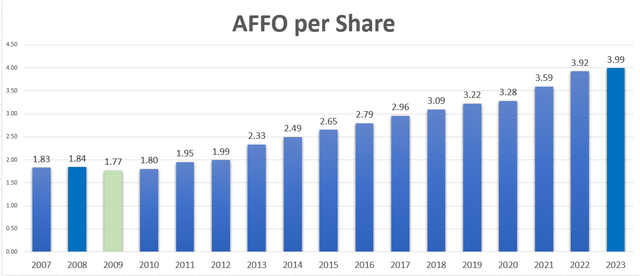
And based on analyst estimates, O is forecasted to grow by over 4% in 2024 and 2024:
iREIT®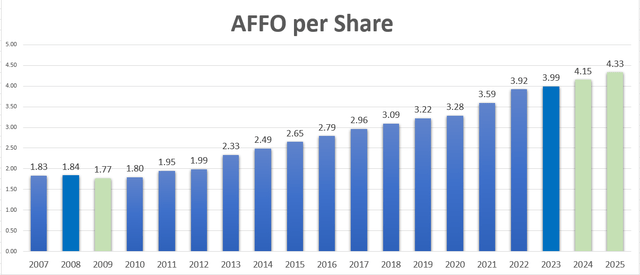
To date, O has declared 639 consecutive common stock monthly dividends throughout its 54-year operating history and increased the dividend 122 times since the company’s public listing in 1994.
As seen below, O did not cut its dividend during the Great Recession (and is now a Dividend Aristocrat) and based upon the conservative payout ratio of 76% (based on AFFO per share) there’s a very good chance the company will continue to boost its dividend.
iREIT®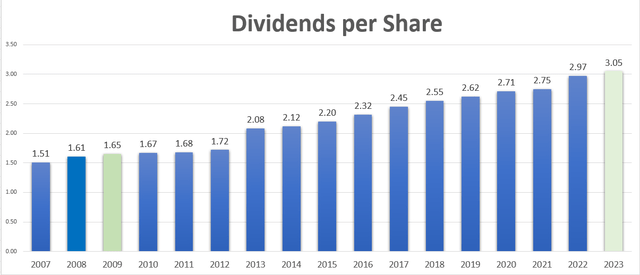
O is a cheap REIT, with a P/AFFO multiple of just 12.1x compared with its normal multiple of 17.7x. The dividend yield is now 6.1%, which is one of the highest seen in over a decade (2009).
Once again, based on the strength of the underlying earnings (past, present, and future) it’s highly likely that O will continue growing profits and distributing them back to investors in the form of dividends. As shown below, iREIT® is targeting shares to return 20%+ annually.
FAST Graphs 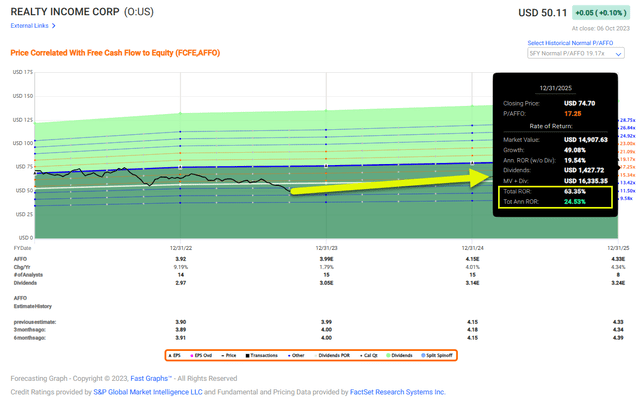
Invest for the Long Run!
I hope you enjoyed my article on EDMP (earnings determine market pricing) and the previous article (what Chuck calls the “twin sister) that stands for “emotions determine market price in the short run. Chuck points out,
“…my contention is that although the correlations between earnings and price are extremely profound long-term, there will be occasions when investors will see a short-term separation between earnings and price over or under.
These are times when emotions such as fear or greed or hype or hysteria take hold and investors throw caution to the wind and behave irrationally.
My thesis on the importance of earnings does not deny this, instead it recognizes this and uses this recognition as an opportunity to make intelligent (not perfect) buy, sell or hold investing decisions, thereby aiding the investor in avoiding obvious mistakes.”
MidAmerica and Realty Income are two prime-time examples of recognizing such an opportunity to “make intelligent (not perfect) buy investing decisions, thereby aiding the investor in avoiding obvious mistakes”.
If you ask me to describe SWAN (sleep well at night) investing in four words, it would be:
The Margin of Safety.
Happy SWAN Investing!
Note: Brad Thomas is a Wall Street writer, which means he’s not always right with his predictions or recommendations. Since that also applies to his grammar, please excuse any typos you may find. Also, this article is free: Written and distributed only to assist in research while providing a forum for second-level thinking.
Read the full article here


