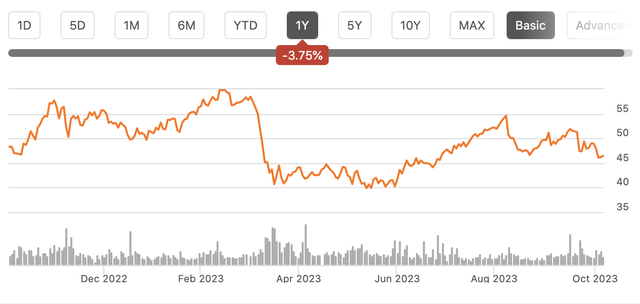
Shares of Brighthouse Financial (NASDAQ:BHF) have been a mixed performer over the past year, losing about 4% of their value. More notably, they had approached $60 before the market turmoil following the banking crisis, and shares have yet to fully recovery. BHF has a complex business-arguably somewhat of a financial “black box”-which has resulted in a low multiple and meaningful upside, so long as markets do not materially correct.
Seeking Alpha
In the company’s second quarter, Brighthouse earned $4.04 in adjusted EPS, which was down from $4.71 last year. On a GAAP basis, it generated a net loss of $3.01. It is not often you see a difference between GAAP and adjusted earnings of over $7, or over 15% of the share price. That alone provides a sense of the complicated nature of Brighthouse’s earnings and business.
Brighthouse, spun out nearly a decade ago by MetLife (MET), is a provider of annuities, in particular variable annuities with much of its base business being policies originated by MET. Fixed annuities are relatively straight-forward; you pay the insurance company an upfront premium and receive the same payment every month (or quarter or year) for the rest of your life. Insurance companies price these based on existing bond yields and face little market or complexity risk.
On the other hand, variable annuities provide a payout until you die, but the amount can vary depending on how markets perform. As with many financial products in the 2000s, they became increasingly complicated with many options to create more variability and customization. In hindsight, some of these policies proved to be difficult to manage, not as profitable as hoped, and capital intensive. This is a reason MET spun out BHF, to get these policies off its balance sheet. It is also why Brighthouse has been slowly trying to pivot its policy mix by offering simpler variable annuities that are easier to manage against.
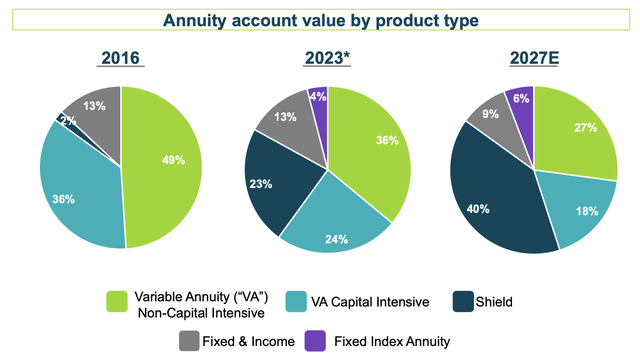
As you can see below, in 2016 shortly after the spin, over one-third of its business was capital intensive VA; today that is just under one-fourth. They are expected to fall further in 2027 based on BHF’s new sales mix. Similarly, traditional VAs are declining from nearly half of the business to just over one-third today. This is occurring as its simpler annuity (branded “Shield”) gains share.
Brighthouse
Brighthouse had $2.47 billion in annuity sales in Q2, flat with last year; for the full year, annuity sales are up 16%. These new sales are helping to shift the business, but it takes time. Because annuities pay out over the balance of your life, they can run, 20, 30 years, or longer. This is why it takes so long to shift product mix. This is another reason investors are cautious towards firms with large VA exposure. If an insurer makes a mistake, by offering too favorable of terms, they are stuck with that poorly performing policy for many years. It is not like auto insurance where a mistake can be corrected 12 months later because policies have such short terms.
Moreover, it can take to time realize actuarial assumptions or market expectations were incorrect, a mistake made in 2017 may not be discovered until now when you do not see the anticipated mortality, for instance. It is possible these flawed assumptions impact multiple years of policies. Variable annuities, given their nature, carry meaningful uncertainty, which is a major reason why a stock like Brighthouse can trade in the $40’s when its adjusted book value is $137.8. The market sees a lot of potential things that could go wrong.
That brings us back to the large difference between GAAP and adjusted EPS. As noted, variable annuities have some market risk to their payout. The insurance company likes to hedge this risk as much as possible, but given policies can last a decade or longer, this requires using a wide array of derivatives, for equity risk, interest rates, etc. If properly constructed, these hedges should offset market fluctuations. However given the bespoke nature of the derivatives, there can be short timing mismatches. GAAP earnings factor in market and hedging gains and losses. Adjusted earnings do not, assuming they will cancel out over time as the firm is economically hedged even if there are temporary accounting swings.
As you can see below, I have included the market and derivative impacts from the past five quarters. They swing massively on a quarterly basis, though market risk and derivatives move in the opposite direction as you would expect. Over the 15 months, they have largely cancelled out. A $630 million favorable gap on a $119 billion investment portfolio during a time of significant market volatility is a sign the hedges are largely working as anticipated.
Brighthouse
This is why it is best to look at adjusted earnings, rather than GAAP results. Given it is impossible to know the exact detail of every hedge, and how hard it is to hedge every risk, for a day, let alone 30 years, markets see a structural risk that Brighthouse’s hedges could at some point not perform and leave the firm with a permanent market loss. This is a reason shares reacted so negatively to the financial stress in late Q1/early Q2. In hindsight, even through this period, the hedges seem to be working. While I feel comfortable with BHF’s hedges, I think investors need to be aware this is a reason the stock trades cheap to book value, and a discount is likely to persist structurally.
Another reason a stock could trade well below book value is skepticism around the value of its assets. I do not view that as the case here. BHF has a $119 billion portfolio. 97% of its fixed-maturity portfolio is investment grade, and BHF has been steadily reducing its below-investment grade exposure for the past two years given macroeconomic uncertainty. Now, $13.4 billion is invested in commercial mortgages. The average loan to value is a modest 61%. Office has been reduced from 40% of mortgages to 24%, for less than 3% aggregate exposure, which is a manageable position. BHF also has a risk-based capital ratio (RBC) of 430-450%, in the upper end of its 400-450% target.
Now, BHF is taking steps to simplify its business. As noted above, it is gradually shifting product mix via new sales. These shifts should make its results over the medium term more predictable, less market sensitive, and hopefully reduce some of the complexity that has caused a discount valuation.
In the company’s September update, it predicted that if markets return 4%, the company will generate $1.5 billion in free cash flow over the next five years and $5-7 billion over the next decade. If markets fall 25% and rates fall to 1%, it still generates $1 and $2-4 billion of free cash flow, respectively. While its reduction of capital intensive variable annuities have reduced upside should markets rise 6.5% or more per year, they have reduced the downside substantially. Back in 2021, under the adverse scenario, it would generate no free cash flow.
It also I clear that BHF, under either scenario, will generate much more cash flow in years 5-10 than years 1-5, as the benefits of its transition bear fruit, given the time it takes to shift the business, given the long life of annuities as discussed above. BHF primarily uses its free cash flow to support buybacks, not dividends. The share count has fallen by 44% since the end of 2015, and it is down nearly 10% over the past year
The pace has slowed somewhat, and BHF has done $64 million in Q2 buybacks and $26 million in the first five weeks of Q3. The holding company, which does the repurchases, has $900 million of liquidity and a $300 million dividend from the operating company is expected later this year. I would expect annual buybacks to run in the ~$200-250 million range over the next 18-36 months, before rising.
Below, I have taken the company’s anticipated 5- and 10-year free cash flow estimates for the base and downside cases, outlined above. I discounted these cash flows back to the present day at 10% and assumed a conservative 5x multiple off of its 10th year cash flow for its terminal value in a decade.
Brighthouse, my own calculation
Under the base scenario of rates following the forward curve and 4% market appreciation, BHF is worth $63 today, representing 37% upside. In the downturn, it would be worth $32, representing 33% downside. However, this downturn scenario assumes a 10-year treasury yield of 1.0%, a level only seen during the aftermath of COVID. This is a very harsh assumption, that is in my view unlikely to occur and sustain for prolonged periods. The longer rates remain higher, the greater the ability of BHF to continue to hedge away long-term interest rate risk, and reduce the impact of the downside case, as well. Additionally, assuming just a 5x multiple on free cash flow may prove conservative, particularly as progress in simplifying its business should help to improve its multiple over time.
Investors should be aware that a severe downturn will impair BHF’s cash flows over the next decade to a degree, but I would view realistic downside as less severe than this. The base case is reasonable in my view, but I expect shares to trade at some discount to this scenario, given the downside risk and general uncertainty. Giving an 80/20 weighting to these two scenarios, I find a fair value of $57 for BHF. At $47, shares are essentially giving a 50/50 weighting to these two outcomes. As I do not think 10-year yields being 1% is a 50% likelihood, that is a compelling entry point.
BHF is a complex business, and it will continue to trade at a discount. However, its hedges have worked fairly well during a period of significant volatility, and the business is gradually shifting to less risky products. I see about 20% upside to the upper $50’s, and I believe investors should begin to build positions here.
Editor’s Note: This article was submitted as part of Seeking Alpha’s Best Value Idea investment competition, which runs through October 25. With cash prizes, this competition — open to all contributors — is one you don’t want to miss. If you are interested in becoming a contributor and taking part in the competition, click here to find out more and submit your article today!
Read the full article here


