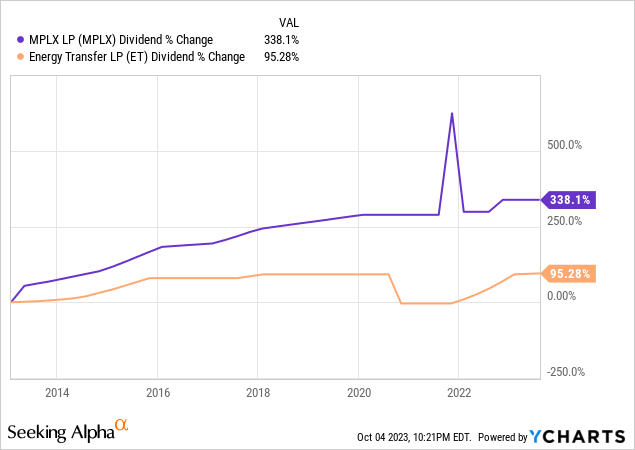
MPLX (NYSE:MPLX) and Energy Transfer (NYSE:ET) are both high-yield BBB-rated midstream infrastructure businesses. Many investors prefer MPLX given that its distribution growth track record is much more consistent than ET’s. Note that MPLX’s large jump and drop in its distribution from 2021 to 2022 on the chart below is merely due to a special distribution. Meanwhile, ET halved its quarterly distribution in late 2020, before fully restoring it and then increasing it slightly above its pre-cut level since then:

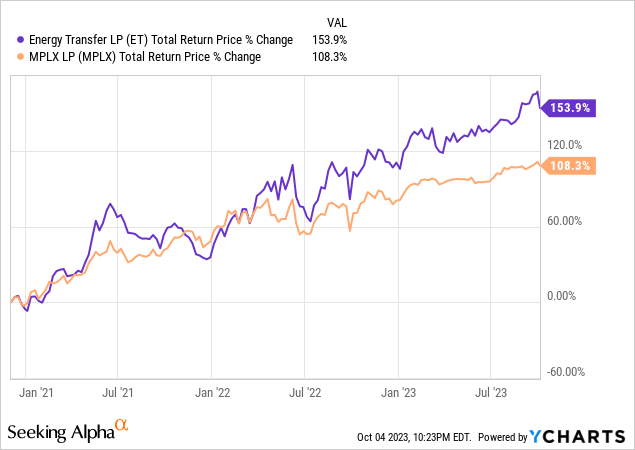
That said, ET has significantly outperformed MPLX in the nearly three years since we added it to our portfolio:

In this article, we compare them side by side and offer our take on which is the best buy right now.
MPLX Vs. Energy Transfer: Business Model
MPLX owns and operates midstream energy infrastructure and logistics assets that operate in two primary segments: Logistics and Storage and Gathering and Processing. Its business activities include the gathering, processing, and transportation of natural gas and the storage, transportation, fractionation, and marketing of natural gas liquids. Additionally, MPLX is involved in the gathering, storage, transportation, and distribution of crude oil, refined products, and other hydrocarbon-based products. It also operates in the inland marine business, transporting various products in the Mid-Continent and Gulf Coast regions, and it has terminal facilities for refined petroleum products. MPLX is a subsidiary of Marathon Petroleum Corporation (MPC), which owns a large stake in MPLX and is also its primary customer.
MPLX’s assets are typically strategically located within or close to Marathon Petroleum refineries and typically serve as the sole providers for the refinery’s specific needs, creating economic barriers to entry for competitors. Moreover, MPLX’s long-term 5-10-year contracts with minimum volume commitments for each Marathon asset give it a very stable cash flow profile, regardless of macro conditions in the energy industry and the broader economy.
ET, meanwhile, owns and operates an extensive network of natural gas transportation pipelines, including interstate natural gas pipelines, storage facilities, and gathering and processing assets in multiple states. ET also sells natural gas to various customers, including utilities, power plants, and industrial users. Additionally, the company is involved in crude oil transportation, terminalling, and marketing activities, as well as the distribution of petroleum products such as gasoline and motor fuels. It also offers services related to natural gas compression, carbon dioxide, and hydrogen sulfide removal, and manages coal and natural resource properties. Unlike MPLX, ET does not have a parent that owns a large stake in it, nor is it beholden to a single large customer.
Furthermore, ET has a much larger asset portfolio with an enterprise value that is nearly twice that of MPLX’s. Moreover, it generates at least 11% and no more than 28% of its adjusted EBITDA from each of its five business segments (crude oil, NGL & refined products, natural gas interstate transport & storage, midstream, and natural gas intrastate transport & storage), giving it greater diversification than MPLX. Similar to MPLX, however, is the fact that it generates the vast majority of its cash flow (~90% of expected adjusted 2023 EBITDA) from commodity price-resistant long-term fee-based contacts. As such, it has a fairly defensive business model that is quite resilient in the face of macro volatility.
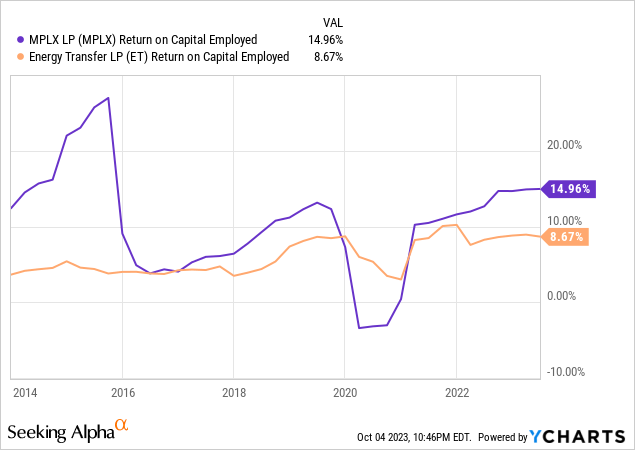
One important item to note is that – apart from a sharp dip during part of the COVID-19 and Saudi-Russian oil price war-induced energy market crash of 2020 – MPLX has consistently generated significantly better returns on capital than ET has. This indicates that its management team has been a better capital allocator than ET’s has over the years:

MPLX Vs. Energy Transfer: Balance Sheet
Both businesses have been deleveraging in recent years, and both have BBB credit ratings with stable outlooks from S&P.
ET’s leverage ratio is now under its 4.5x long-term target and is likely to stay within the 4.0x-4.5x range for the foreseeable future depending on capital allocation opportunities for ET relative to the attractiveness of retiring rather than refinancing upcoming debt maturities.
One major positive for ET is that it is expected to generate between $1.7-$1.8 billion in free cash flow net of distributions in 2024, ~$2.4 billion of free cash flow net of distributions in 2025, ~$3.1 billion of free cash flow net of distributions in 2026, and ~$3.5 billion of free cash flow net of distributions in 2027. This should enable it to cover most – if not all – of its upcoming debt maturities over that period of time. As a result, it enjoys significant flexibility in the face of growing uncertainty about the future outlook for interest rates. As a result, we feel very good not only about the security of its current credit rating but also its distribution level.
MPLX, meanwhile, has an even lower leverage ratio of 3.5x, down from 3.7x two years ago and 4.0x four years ago. Moreover, it has well-balanced and very manageable debt maturities in the coming years. Similar to ET, it is expected to generate very healthy levels of free cash flow net of distributions over that time period as well. It is expected to generate ~$1.2-$1.4 billion in free cash flow net of distributions each year through 2027, equating to a little over $5 billion in free cash flow net of distributions over that span. In comparison, it has about $6 billion in debt maturing over that period, giving it significant capital markets flexibility and minimal need to access bond markets if it chooses not to in the face of rising interest rates. As a result, as with ET, we feel very good not only about the security of its current credit rating but also its distribution level.
MPLX Vs. Energy Transfer: Distribution Outlook
As already pointed out, both distributions appear to be on very sound footing thanks to the stable cash flow profiles and strong balance sheets for both businesses. Moreover, MPLX is expected to cover its distribution by 1.56x this year and ET is expected to cover its distribution by 1.95x this year, giving both distributions very adequate coverage.
Through 2027, MPLX is expected to grow its distribution at a 5.0% CAGR while ET is expected to grow its distribution at a 4.3% CAGR. ET’s distribution is likely going to grow at a slower pace than MPLX’s because it has more growth opportunities in front of it, so management will be investing in those instead. That being said, it is interesting to note that ET is only expected to grow its DCF per unit at a 4% CAGR over that span whereas MPLX is expected to grow its DCF per unit at a nearly as strong 3.4% pace despite growing its distribution faster and not retaining nearly as much cash as ET is expected to. This is because MPLX tends to generate higher returns on its capital, thereby reducing its need to retain as much cash flow as ET does in order to deliver similar growth rates.
MPLX Vs. Energy Transfer: Valuation
ET appears to be significantly cheaper than MPLX on an EV/EBITDA and on a P/DCF basis, though both offer near identical current distribution yields.
| EV/NTM EBITDA | P/2024E DCF | NTM Yield | |
| ET | 7.72x | 5.21x | 9.5% |
| MPLX | 9.19x | 6.85x | 9.6% |
Investor Takeaway
ET appears to be the winner here given that it is significantly cheaper than MPLX and its portfolio is also quite a bit more diversified. However, MPLX has generated consistently better returns on capital over the course of its history, its distribution payout has proven to be more consistent, and has grown at a faster clip over the long term. Moreover, MPLX currently offers the same yield as ET and is expected to grow its distribution at a slightly faster clip moving forward while also having a significantly lower leverage ratio. As a result, we can definitely see the case for holding MPLX over ET.
However, what gives ET the edge in our view is that it is not beholden to a parent/major client like MPLX is to MPC. Between its greater portfolio diversification, a wider array of growth projects, significantly cheaper valuation, and better governance structure, we give the edge to ET, though we rate both as Buys.
Editor’s Note: This article discusses one or more securities that do not trade on a major U.S. exchange. Please be aware of the risks associated with these stocks.
Read the full article here


