Yesterday, stocks fell sharply in response to another increase in long-term Treasury yields with the 10-year breaching 4.8%. I equate this bond sell-off to the kind of panic you might see in a movie theater if someone yelled “fire.” The yield on the 10-year has risen a stunning 50 basis points in just the past two weeks. This panic selling has nothing to do with economic fundamentals, as inflation continues to abate, while the rate of economic growth has started to slow, both of which should bring yields down. It has everything to do with misguided rhetoric from Fed officials who assert short-term rates may need to stay higher for longer to squash inflation. Therefore, any incoming economic data that is stronger than expected fuels fears of higher for longer, even when it has had little to no inflationary impact.
Finviz
For example, the consensus expected job openings to fall from 8.82 million in July to 8.75 million in August. Instead, openings rose to 9.61 million with most of the increase coming from professional and business services. Upon release of this report yesterday at 10 a.m., yields soared, and stocks plunged, as though it guaranteed the well-entrenched disinflationary trend would stall. We have had an extraordinarily high number of job openings all year long, but that is only relevant as it relates to job creation and wage growth, which are primary drivers of inflation.
Bloomberg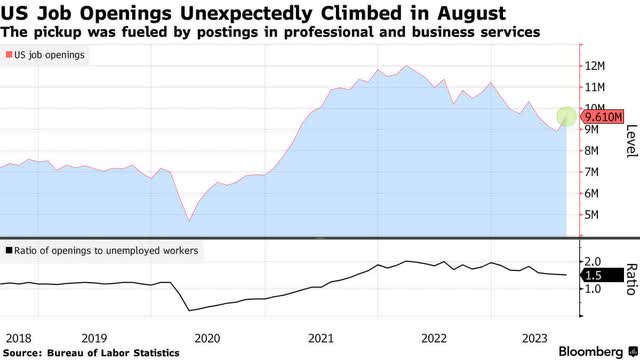
Job openings do not necessarily fuel inflation. It is the addition of new jobs to the workforce that can increase the demand for goods and services and place upward pressure on prices. Despite the number of openings, job growth has slowed dramatically over the past year and fallen to just 150,000 on average over the past three months. If stubbornly high job openings are not leading to the creation of more jobs, then Fed officials and investors need to downplay the importance of that datapoint as a reason to maintain rates higher for longer.
TradingEconomics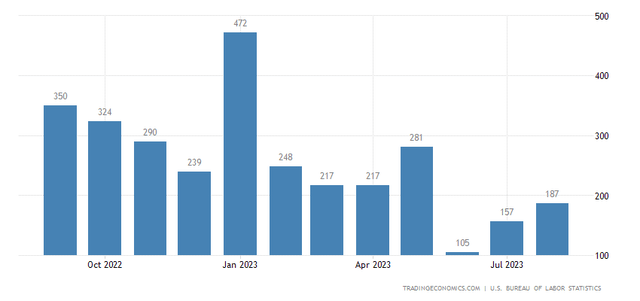
Additionally, related data calls into question the accuracy of the JOLTS report. The latest seasonal job postings report from Indeed showed that for the first time since the pandemic, the seasonal job postings we see around this time of year have fallen below pre-pandemic levels. Postings today are down 3% from the same time of year in 2019. That is not a disaster, but it is clearly not exhibiting the kind of strength that Fed officials and investors seem to think exists from the JOLTS report. This is not a reason to remain higher for longer.
Indeed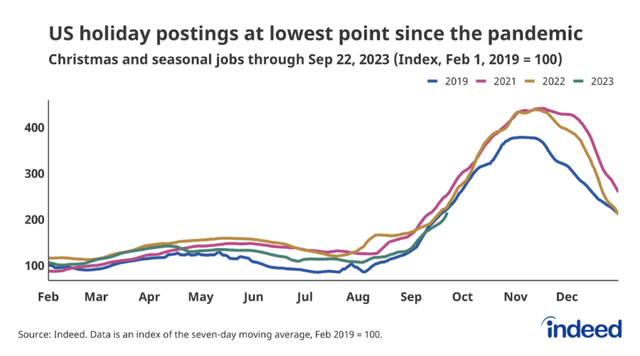
While an elevated level of job openings can put upward pressure on wages, the incoming data on wage growth proves otherwise. Despite 9.6 million job openings, wage growth has steadily declined from its peak in 2021. These datapoints are all consistent with a soft landing, which is a balance between economic strength and weakness. Unfortunately, there are lots of naysayers who seem to be rooting for a recession and another bear market. They either inaccurately forecasted both more than a year ago and don’t want to be proven wrong, or they are in very liquid positions and want to profit from the corresponding declines in risk assets that come with recessions and bear markets.
TradingEconomics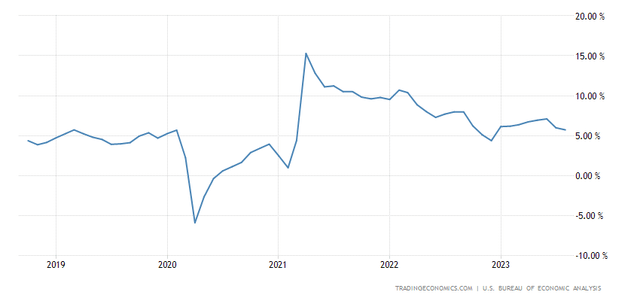
The obsession with higher for longer rates really has no solid ground to stand on. The Fed has largely accomplished its goal of achieving stable prices. Its failure to acknowledge such is intended to keep inflation expectations in check until official reports reflect that the Fed has met its numerical target of 2%. Excluding rent, the August consumer price index rose an annualized 1.9% and the core rate rose 2.2%. Anyone can look at the new rental rates each month that are working their way into the annualized number and discern that the headline and core inflation numbers will be at the Fed’s 2% target within the next 6-9 months. Fed officials who argue otherwise are playing word games to manage inflation expectations and prevent financial conditions from loosening too soon.
Bloomberg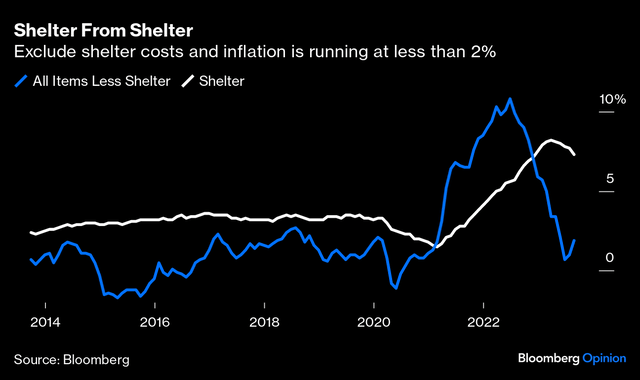
We are likely to be close to the peak in long-term rates. DataTrek points out that Treasury market volatility has reached 2-standard deviations to the downside with a decline of 16.4%, based on the past 100 days of trading. As the chart below shows, every time we saw similar declines dating back to 2003 there was a reversal over the subsequent 100-day period. The year-end rally in stocks should start when long-term bond yields stabilize.
DataTrek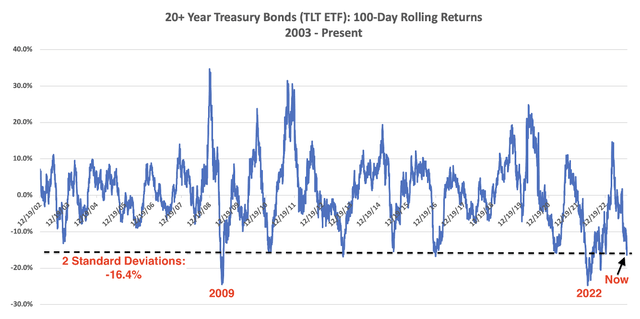
The major market averages are deeply oversold and due for a bounce. I still believe we will see a sizeable fourth-quarter rally that restores the gains we made just two months ago, and upcoming earnings reports should be the catalyst. Some encouraging data on how the market performs after being as oversold as it is today is shown in data provided below by QuantifiableEdges. The S&P 500 has declined four weeks in a row and remained above its 40-week moving average just 15 times since 1975. The S&P 500 finished higher 10 weeks later in 14 out of those 15 times. Those are good odds for 2023.
QuantifiableEdges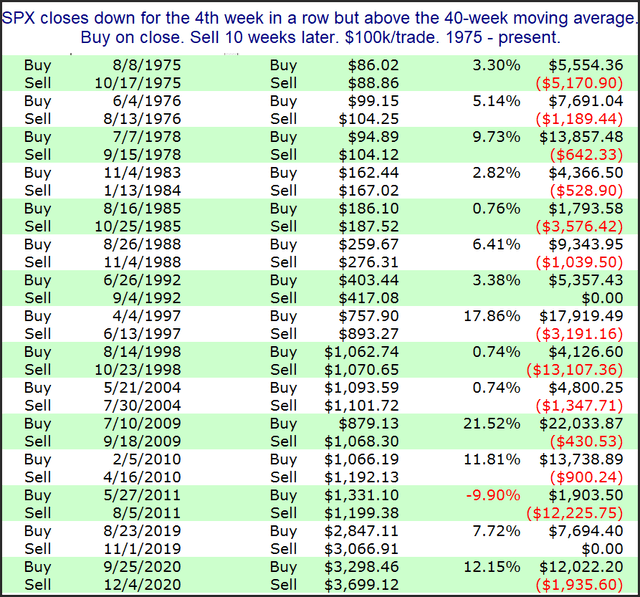
Read the full article here


