A Quick Take On Birkenstock
Birkenstock Holding Limited (BIRK) has filed proposed terms to raise $1.5 billion in gross proceeds from the sale of its ordinary shares in an IPO, according to an amended F-1/A SEC registration statement.
The firm markets premium footwear products to consumers worldwide.
My outlook on the Birkenstock IPO is Neutral [Hold] due to high valuation expectations from management and my doubts about the health of consumer demand in important markets.
Birkenstock Overview
London, UK-based Birkenstock Holding Limited was founded in 1774 in Germany to design and sell comfortable and natural footwear to consumers.
Management is headed by Chief Executive Officer Mr. Oliver Reichert, who has been with the firm since 2009 and was previously at “Deutsches Sportfernsehen (currently Sport1), including as a reporter and then as Chief Executive Officer between 2006 and 2009.”
The company has more than 700 “silhouettes” of different shoes, but its five best-selling silhouettes generated 76% of the firm’s revenue in fiscal 2022.
As of June 30, 2023, Birkenstock has booked fair market value investment of $2.1 billion in equity from investors, including private equity firm L Catterton.
Birkenstock Customer Acquisition
The firm operates with a multi-channel “engineered distribution” model, allocating its limited supply to wholesalers and its growing direct-to-consumer [DTC] channel.
The company has grown revenue at a CAGR of 20% from fiscal 2014 through fiscal 2022.
Selling and Distribution expenses as a percentage of total revenue have trended higher as revenues have increased, as the figures below indicate:
|
Selling And Distribution |
Expenses vs. Revenue |
|
Period |
Percentage |
|
Nine Mos. Ended June 30, 2023 |
27.7% |
|
FYE September 30, 2022 |
27.9% |
|
FYE September 30, 2021 |
24.5% |
(Source – SEC.)
The Selling and Distribution efficiency multiple, defined as how many dollars of additional new revenue are generated by each dollar of Selling and Distribution expense, fell to 0.6x in the most recent reporting period, indicating reduced efficiency in this regard, as shown in the table below:
|
Selling And Distribution |
Efficiency Rate |
|
Period |
Multiple |
|
Nine Mos. Ended June 30, 2023 |
0.6 |
|
FYE September 30, 2022 |
0.8 |
(Source – SEC.)
Birkenstock’s Market & Competition
According to a 2023 market research report by Grand View Research, the global market for footwear of all types was an estimated $388 billion in 2022 and is forecasted to reach $543 billion by 2030.
This represents a forecast CAGR of 4.3% from 2023 to 2030.
The main drivers for this expected growth are rising demand for athletic-oriented footwear and growing sales enabled by e-commerce channels.
Also, the chart below indicates that as of 2022, a strong majority of footwear was of the “non-athletic” type:
Global Footwear Market (Grand View Research)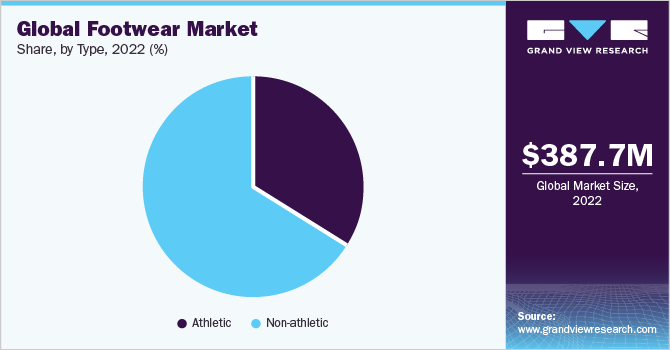
Major competitive or other industry participants include the following:
-
Teva
-
Crocs
-
Chaco
-
Naot
-
Studio Moulded
-
Mad Love
-
Will’s Vegan Store
-
Others.
Birkenstock Holding Limited Financial Performance
The company’s recent financial results can be summarized as follows:
-
Slowing top line revenue growth
-
Increasing gross profit
-
Stable gross margin
-
Reduced operating profit
-
Higher cash flow from operations.
Below are relevant financial results derived from the firm’s registration statement:
|
Total Revenue |
||
|
Period |
Total Revenue |
% Variance vs. Prior |
|
Nine Mos. Ended June 30, 2023 |
$ 1,173,236,400 |
21.3% |
|
FYE September 30, 2022 |
$ 1,342,259,640 |
29.2% |
|
FYE September 30, 2021 |
$ 1,038,971,880 |
|
|
Gross Profit (Loss) |
||
|
Period |
Gross Profit (Loss) |
% Variance vs. Prior |
|
Nine Mos. Ended June 30, 2023 |
$ 714,877,800 |
25.2% |
|
FYE September 30, 2022 |
$ 809,786,160 |
71.5% |
|
FYE September 30, 2021 |
$ 472,090,680 |
|
|
Gross Margin |
||
|
Period |
Gross Margin |
% Variance vs. Prior |
|
Nine Mos. Ended June 30, 2023 |
60.93% |
1.9% |
|
FYE September 30, 2022 |
60.33% |
32.8% |
|
FYE September 30, 2021 |
45.44% |
|
|
Operating Profit (Loss) |
||
|
Period |
Operating Profit (Loss) |
Operating Margin |
|
Nine Mos. Ended June 30, 2023 |
$ 247,360,050 |
21.1% |
|
FYE September 30, 2022 |
$ 392,069,160 |
29.2% |
|
FYE September 30, 2021 |
$ 147,584,160 |
14.2% |
|
Comprehensive Income (Loss) |
||
|
Period |
Comprehensive Income (Loss) |
Net Margin |
|
Nine Mos. Ended June 30, 2023 |
$ (3,415,650) |
-0.3% |
|
FYE September 30, 2022 |
$ 316,857,960 |
23.6% |
|
FYE September 30, 2021 |
$ 122,703,120 |
11.8% |
|
Cash Flow From Operations |
||
|
Period |
Cash Flow From Operations |
|
|
Nine Mos. Ended June 30, 2023 |
$ 253,022,700 |
|
|
FYE September 30, 2022 |
$ 252,866,880 |
|
|
FYE September 30, 2021 |
$ 190,914,840 |
|
|
(Glossary Of Terms.) |
As of June 30, 2023, Birkenstock had $304.0 million in cash and $2.5 billion in total liabilities.
Free cash flow during the twelve months ending June 30, 2023, was $198.0 million.
Birkenstock’s IPO Details
BIRK intends to sell 10.8 million shares of common stock and the selling shareholder, L Catterton, will offer 21.5 million shares at a proposed midpoint price of $46.50 per share for gross proceeds of approximately $1.5 billion, not including the sale of customary underwriter options.
Existing shareholder Financiere Agache has indicated a non-binding interest to purchase up to $325 million of the shares of the IPO at the IPO price.
Durable Capital Partners and Norges Bank Investment Management have indicated a non-binding interest to purchase up to an aggregate of $300 million worth of the shares of the IPO at the IPO Price.
The company’s enterprise value at IPO (excluding underwriter options) will approximate $9.9 billion.
The float to outstanding shares ratio (excluding underwriter options) will be approximately 17.17%.
Per the firm’s most recent regulatory filing, it plans to use the net proceeds as follows:
We currently intend to use the net proceeds we receive from this offering to repay approximately €100 million of the Vendor Loan and approximately €313 million in aggregate principal amount of borrowings outstanding under the Senior Term Facilities.
(Source – SEC.)
Management’s presentation of the company roadshow is available here until the IPO is completed.
The firm is subject to various legal proceedings, that in the opinion of management, are not expected to have a material adverse effect on its business or financial condition.
Listed underwriters of the IPO are Goldman Sachs, J.P. Morgan, Morgan Stanley and numerous other investment banks.
Valuation Metrics For Birkenstock
Below is a table of the firm’s relevant capitalization and valuation metrics at IPO:
|
Measure [TTM] |
Amount |
|
Market Capitalization at IPO |
$8,733,890,028 |
|
Enterprise Value |
$9,913,935,678 |
|
Price / Sales |
5.64 |
|
EV / Revenue |
6.40 |
|
EV / EBITDA |
28.47 |
|
Earnings Per Share |
$0.47 |
|
Operating Margin |
22.49% |
|
Net Margin |
5.88% |
|
Float To Outstanding Shares Ratio |
17.17% |
|
Proposed IPO Midpoint Price per Share |
$46.50 |
|
Net Free Cash Flow |
$198,031,980 |
|
Free Cash Flow Yield Per Share |
2.27% |
|
Debt / EBITDA Multiple |
4.26 |
|
CapEx Ratio |
2.02 |
|
Revenue Growth Rate |
21.29% |
|
(Glossary Of Terms.) |
(Source – SEC.)
As a reference, a potential public comparable would be On Holding AG (ONON); shown below is a comparison of their primary valuation metrics:
|
Metric [TTM] |
On Holding AG |
Birkenstock |
Variance |
|
Price / Sales |
4.77 |
5.64 |
18.3% |
|
EV / Revenue |
4.94 |
6.40 |
29.6% |
|
EV / EBITDA |
48.07 |
28.47 |
-40.8% |
|
Earnings Per Share |
$0.52 |
$0.47 |
-9.1% |
|
Revenue Growth Rate |
66.5% |
21.29% |
-67.99% |
|
Net Margin |
2.7% |
5.88% |
118.63% |
|
(Glossary Of Terms.) |
(Source – SEC and Seeking Alpha.)
Commentary About Birkenstock
BIRK is seeking U.S. public capital market investment to reduce its debt, for general working capital and for its private equity investor to receive a significant amount of the proceeds.
The company’s financials have generated reduced top line revenue growth, higher gross profit, flat gross margin, and lowered operating profit but increasing cash flow from operations.
Free cash flow for the twelve months ending June 30, 2023, was $198.0 million.
Selling and Distribution expenses as a percentage of total revenue have trended higher as revenue has grown; its Selling and Distribution efficiency multiple fell to 0.6x in the most recent reporting period.
The firm currently plans to pay no dividends and to retain any future earnings for its working capital requirements.
BIRK’s recent capital spending history indicates it has spent significantly on capital expenditures as a percentage of its operating cash flow.
The market opportunity for footwear is large and expected to grow at a low rate of growth in the coming years.
Business risks to the company’s outlook as a public company include intensifying competition from similar footwear companies via online marketplace channels.
Management is seeking an Enterprise Value / Revenue multiple of 6.4x despite much faster-growing On Holding currently being valued by the market at a multiple of about 5x.
Birkenstock is a premium brand that is facing a weakening consumer in a number of major markets.
Germany is in recession, and the U.S. consumer appears to be running out of excess cash reserves as 2023 comes to an end, so I’m concerned about Birkenstock Holding Limited’s near-term prospects as it shows slowing revenue growth.
In addition, the company’s private equity firm investor seeks to cash out part of its investment in the IPO, which is unusual.
Therefore, my outlook on the Birkenstock Holding Limited IPO is Neutral [Hold] due to high valuation and doubts about the health of consumer demand in important markets.
Expected IPO Pricing Date: Week of October 9, 2023
Read the full article here