With the market continuing to adjust to higher interest rates for longer, investors might be having a tough time finding investments to reallocate their money to. One stable performer I still feel comfortable with is good old reliable Coca-Cola (NYSE:KO) which currently sits 13.9% below 52-week highs with a dividend yield of 3.30%. The company’s past growth goes a good way towards justifying the 23.2x TTM P/E as this article will discuss.
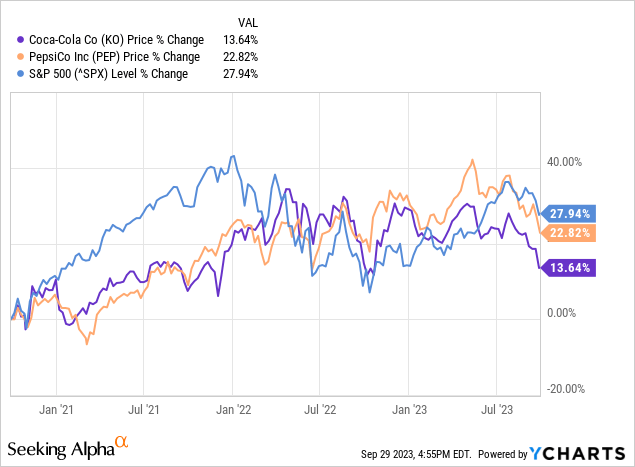
Coca-Cola continues to grow its brand portfolio with a global distribution network that is hard to match and can be leveraged to drive growth across existing and new brands. As we go through Coca-Cola’s latest results and valuation highlights, we will compare back to PepsiCo (PEP) with the conclusion that Coca-Cola looks to be the better opportunity at today’s market prices with both a cheaper valuation and better growth rates.
Latest Q2 Results had Upgraded Guidance
Coca-Cola’s latest Q2 results released back in July show continued growth with total unadjusted revenues increasing 6% and operating income increasing 3%. GAAP EPS grew 34% $0.59 with comparable EPS (non-GAAP) growing 11% to $0.78. The strong results allowed management to increase guidance to for the year to organic revenue growth of 8% to 9%, which includes positive volume growth while continuing to be led by price mix. Coca-Cola is now expecting comparable EPS growth of 5% to 6% from $2.48 in 2022. This would imply mid-point guidance around $2.62 for 2023 and a forward P/E of 21.4x.
In the latest quarter, global inflation drove organic revenues (non-GAAP) growth of 11% with a breakdown of 10% growth in price/mix and 1% growth in concentrate sales. Management mentioned that several input commodities like sugar and juice remain elevated and some favorable hedges will be rolling off to less favorable rates in the coming quarters. The company expects per case commodity price inflation in the range of a mid-single-digit impact on comparable cost of goods sold in 2023. COGS remain elevated in the latest quarter around 41% of revenues compared to only 37% pre-COVID in 2018.
SG&A expenses on the other hand remained under control at Coca-Cola up only 0.4% compared to Q2 2022 and 1.7% compared to the YTD 2022 period. Over the past few years, the positive side of having to adapt to COVID is that Coca-Cola has continued its drive to be a leaner company able to return more money to shareholders. Coca-Cola’s operations were only briefly touched by the COVID pandemic but have recovered nicely already with revenue continuing to hit new highs. Even though Coca-Cola is a consumer staples company, their exposure to dining, sports, and other entertainment events led to revenue declines of 11.4 over the 2019 to 2020 fiscal years.
The company is now present within multiple beverage categories including juice, energy, coffee, and milk products. Besides the namesake Coca-Cola brand, the company’s brand portfolio now includes names such as Monster energy drinks, SmartWater, BodyArmour, Costa coffee and Fairlife milk products as well as experiments into alcohol again with product partnerships for pre-bottled coolers such as Jack Daniel’s and Coca-Cola. The company continues to acquire brands and roll them out through a global distribution network that totals 30 million customer retail outlets as of the latest investor presentation. Small bolt on acquisitions are part of the regular go-to playbook for Coca-Cola that I expect can lead to above market growth for years to come.
Highly Profitable and Growing Company
Coca-Cola’s global brand power has allowed the company to grow rapidly while maintaining a high level of profitability. Over the past decade, the company has achieved average return on equity (ROE) and return on invested capital (ROIC) of 38.5% and 15.7% respectively. This level of profitability is well above my rule of thumb of 15% ROE and 9% ROIC, allowing me to be confident that, in my opinion, the company is able to maintain and continue to increase its intrinsic value in the future. Pepsi outperforms Coca-Cola on these profitability figures with ROE and ROIC of 50.3% and 21.3%, respectively, as readers of my recent article on Pepsi will have seen. At the end of the day though, investing is all about what investors are earning on their equity investment at today’s share prices.
Historical Profits and Growth at Coca-Cola (compiled by author from company financials)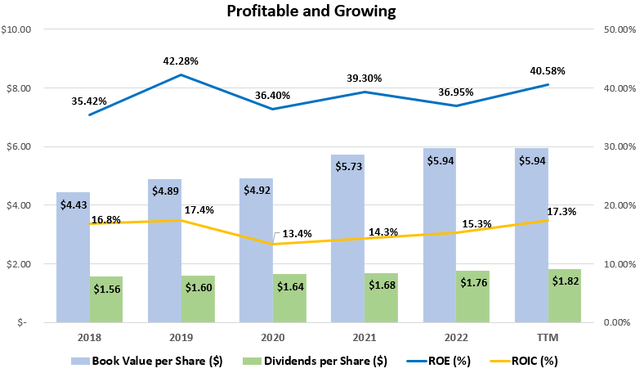
Over the past 5 years, Coca-Cola has seen average revenue per share growth and EPS growth of 7.3% and 10.0% respectively. SG&A has been kept under control with average annual increases of 5.4%, notably lower than revenue growth. Pepsi outperforms Coca-Cola only on the revenue growth figure with Pepsi clocking in a 5-year growth rate of 8.4%. However, EPS growth at Pepsi has been lower at only 2.7% due partially to SG&A expenses growing by 8.2% annualized per year. This growth in SG&A expenses both outpaces revenue growth at Pepsi as well as shows less efficient growth compared to Coca-Cola. Unfortunately, this leaves Pepsi with noticeably higher SG&A expenses which represent 40% of revenue compared to only 17% at Coca-Cola in the latest year.
Excess Cashflows from Great Brands
Strong businesses with global brands and scale such as Coca-Cola are able to generate cash beyond what is needed to fund operations. With capital expenditures and acquisitions taking up an average 12% and 11%, respectively, of cash flow from operations over the past 5 years, this leaves approximately 77% to be returned to investors in the form of dividends and share repurchases. With average cash flow from operations of $11.2 billion over the past three years, this 77% would imply free cash flow to shareholders of $8.0 billion for around a 3.3% free cash flow yield at the current $242.1 billion market capitalization. While this might not seem like a high yield by itself, adding the growth rates discussed in this article could take this yield above my target 9% rate.
Cash Flow Analysis of Coca-Cola (compiled by author from company financials)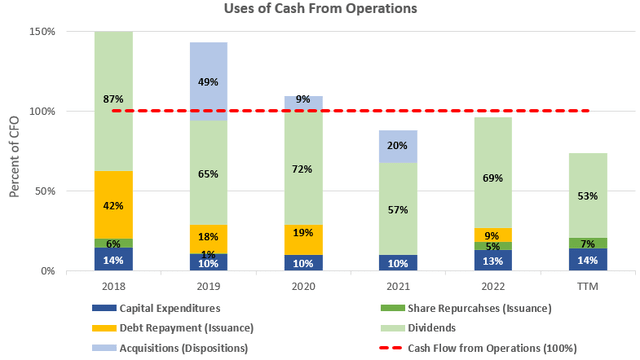
The cash flow generation abilities of Coca-Cola with 77% still available for shareholders smash those of Pepsi at 46% free cash flow conversion given they have had similar growth rates (+1.1% revenue growth for Pepsi). The difference stems from Pepsi’s 41% of cash flows being spent of purchases of property plant and equipment over the period compared to only 12% at Coca-Cola. This is a big difference that in my opinion shows the strength of the brand and extra spending which Pepsi has to do in order to keep up.
Conservatively Financed
Coca-Cola knows its financial borrowing capabilities as a consumer staples company and leverages itself nicely. The company’s financial leverage ratio has decreased in recent years and now sits at 3.6x as of the latest quarter. Interest coverage at currently sits at a healthy 10.0x for the TTM period and only got as low as 6.8x coverage in 2020 during COVID.
Capital Structure Analysis (compiled by author from company financials)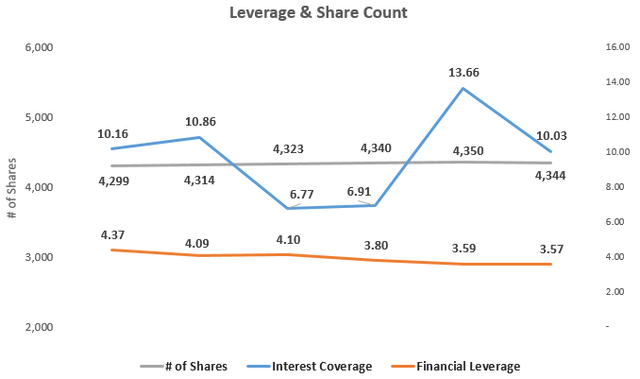
What does a Sustainable Growth Rate Look Like for Coca-Cola?
We should compare Coca-Cola’s average 7.3% revenue growth rate mentioned earlier to what could theoretically be able to be achieved sustainably. A company’s sustainable growth rate is the growth that can be achieved without changing the capital structure of the business which makes sense for a mature business such as Coca-Cola. With an average ROE of 38.5% as discussed earlier and a dividend payout ratio of 76% over the TTM, Coca-Cola’s sustainable growth rate would be calculated at 9.4% (38.5% ROE x [100% – 76% payout rate]). We will take this long-term growth rate and add it on top of the other shareholder yields we have discussed in this article.
This 9.4% SGR from Coca-Cola is slightly above Pepsi’s 7.7% SGR and goes back to the ease of growth through efficient operations and great brands. The SGR is similar to the 5-year historical growth rates mentioned earlier which helps me get comfortable adding them on top of the pre-growth earnings yields.
Getting a Sense of Valuation
Coca-Cola’s 23.2x TTM P/E ratio can also be expressed as a 4.3% earnings yield, but I also always like to examine the relationship between average ROE and price-to-book value in what I call the Investors’ Adjusted ROE. Investors’ Adjusted ROE examines the average ROE over a business cycle and adjusts that ROE for the price investors are currently paying for the company’s book value or equity per share.
With Coca-Cola earning an average ROE of 38.5% over the past decade and shares currently trading at a price-to-book value of 9.43x when the price is $55.98 this would yield an Investors’ Adjusted ROE of only 4.2% for an investors’ equity at that purchase price, if history repeats itself. This is well below the 9% that I like to see, but we could add the 9.4% sustainable growth rate or 8.6% average of the historical revenue and EPS growth rates discussed earlier to increase the potential total return up to 13.5% or 12.5%, respectively. Below are the potential yields graphed for Coca-Cola with growth rates added as discussed in this article. We will take a look at how this compares to Pepsi next before we summarize.
Potential Shareholder Yields from Coca-Cola (compiled by author from company financials and market data)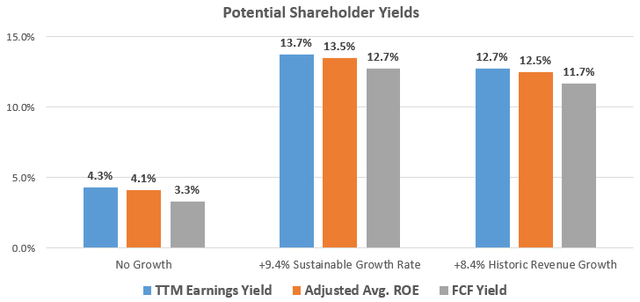
Coca-Cola vs Pepsi Relative Valuations
To summarize our comparison, below is a table outlining the metrics discussed in this article for both Coca-Cola and Pepsi. As can be seen, the lower growth rates of Pepsi do not do enough to justify the higher valuation relative to Coca-Cola. The growth comparison for these companies shows Coca-Cola actually having the higher achieved historical growth and SGR compared to Pepsi. The higher upfront (pre-growth) shareholder yields from Coca-Cola get me more excited from an investment standpoint compared to Pepsi, especially considering the higher brand value I attribute to Coca-Cola along with their leaner operations.
Valuation Comparison of Coke vs Pepsi (compiled by author from company financials and market data)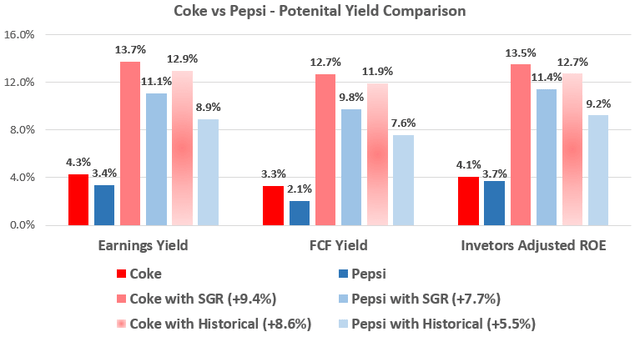
Takeaway for Investors
Both Coca-Cola and Pepsi are great companies which I would like to own at the right price and both remain on my watch list to buy on any broad weakness. Coca-Cola is the better brand of the two and the better operator of the two in my opinion as shown through their lower SG&A expenses. In today’s inflationary environment with growth stocks under pressure from higher rates, I prefer the company that trades relatively cheaper yes has just as impressive growth, which is Coca-Cola.
Read the full article here


