Not since November of last year have we seen oil prices where they are today. We are close, by far, to the highest pricing that crude has traded at all year. As of this writing, WTI crude, for instance, is at $91.18 per barrel. Not surprisingly, Brent crude is even higher at $94.78 per barrel. Given the state of the economy more broadly, I can understand why some may believe that oil prices are going to drop in the near term. This is a distinct possibility. This belief might even be emboldened by data provided by the EIA (Energy Information Administration) that shows this year and next year resulting in global supplies outpacing global demand. However, from what we are seeing in the pricing environment and from what we are seeing from OPEC itself, the data provided by the EIA is almost certainly incorrect and it wouldn’t be shocking to see prices rise even further from here.
Expect high prices to remain
The last article that I published that covered the oil market generally came out in early April of this year. At that time, I was talking about the new OPEC+ production cut and how that represented a “massive gift” to the oil sector. Normally when I talk about investing, I like to identify individual companies that should rise or fall materially. But when it comes to the oil patch, there are many different types of companies to choose from, with each one having a significantly different risk vs. reward payoff compared to the others. For some investors, it just makes it easier to buy into an ETF that appreciates if oil prices rise or drops if they fall.
Back then, the ETF I chose as the primary emphasis for my article was United States Oil Fund, LP ETF (NYSEARCA:USO). But there are plenty of others to choose from, each one with its own positives and negatives. Examples include United States Brent Oil Fund ETF (BNO), ProShares Ultra Bloomberg Crude Oil ETF (UCO), Invesco DB Oil Fund ETF (DBO), United States 12 Month Oil Fund ETF (USL), Direxion Daily S&P Oil & Gas Exp. & Prod. Bull 2x Shares ETF (GUSH), and MicroSectors U.S. Big Oil Index 3X Leveraged ETNs (NRGU). To be clear, investors would be wise to evaluate each of these ETFs individually to see which one best fits their own investment preferences and risk appetite. But in general, one thing that these all should have in common is that, as oil prices rise, they should appreciate. This should be true at least in the short term.
Author – EIA Data
Regardless of the vehicle that each individual investor chooses to play in the oil market, a case could be made by some that prices are too high and should drop from here. There’s certainly data to support that view. Take data provided by the EIA, for instance. In its most recent Short-Term Energy Outlook, which was published earlier this month, the agency calculated that, for 2023, global oil supply would come in at about 101.18 million barrels per day. This would be about 0.21 million barrels per day higher than the 100.97 million in consumption that would be experienced. This disparity might not seem like much to some investors. But it could have a major impact on global oil markets if true. The total excess supply, spread over a single year, would be 76.65 million barrels.
Author – EIA Data
Now, it’s important to point out that just because inventories are rising that this shouldn’t necessarily translate to a bearish outlook on oil. It all depends on how much crude already is out there. Generally, the range that should be considered healthy for the environment would be between 55 and 60 days’ worth of supply of crude in OECD nations. Whenever this number starts ticking above 60, we start to drift into bearish territory. Based on the STEO report issued, by the end of this year, we should be at roughly 60.57 days’ worth of supply for OECD nations. That would translate to excess crude amongst developed nations of 26 million barrels. To make matters worse, the 2024 calendar year should see global demand of 102.88 million barrels per day. That’s 0.55 million barrels per day higher than the 102.33 million barrels per day of consumption that has been forecasted. That would translate to 200.75 million barrels of additional crude throughout the year, with OECD inventories climbing to 2.84 billion barrels, or 62.14 days.
EIA
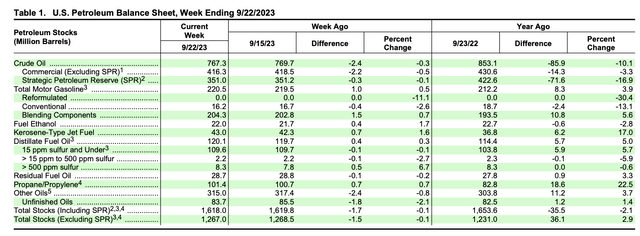
Looking at the most recently available weekly data, we see that domestic crude inventories for the US, excluding what’s in the SPR (Strategic Petroleum Reserve), are about 1.27 billion barrels. That’s an increase over the 1.23 billion barrels of crude seen one year earlier. However, if we include the SPR into the picture, domestic inventories would have declined from 1.65 billion barrels to 1.62 billion. This is because, in order to combat high oil prices, the US has drained a lot of the oil in the SPR, taking inventories from 422.6 million barrels last year to 351 million this year.
So to summarize, what we have on the bearish side of the equation is the EIA forecasting continued growth in production that exceeds consumption. We have evidence in the form of existing inventories of the picture looking worse than it did last year if we ignore the SPR. Although not mentioned previously, oil production also is the highest that it has been in more than two years, with output averaging 12.90 million barrels per day here at home. And you also have high pricing that, in theory, should attract more drillers that would, in turn, cause even more supply to come onto the market.
All of this is fine, but there are some issues with the data from what I can see. For starters, while this is not necessarily an issue, the timing for oil prices to climb looks right. Even though the EIA has forecasted excess supply on a global scale for this year in its entirety, the current quarter that we are in, which is the third quarter, should actually see demand outpace supply to the tune of 0.58 million barrels per day. And in the fourth quarter, we should see demand outpace supply by 0.23 million barrels per day. All combined, this should cause global inventories to drop by 74.5 million barrels between the start of the third quarter and the end of this year.
But when you dig into the actual data provided by the EIA, you end up with issues as well. For starters, the agency has Russia producing 10.57 million barrels of crude per day in the second quarter and 10.48 million barrels per day in the third quarter. For 2023 as a whole, the estimate is 10.64 million barrels per day. However, Russia has significantly reduced its own output. S&P, for instance, recently estimated that, through 2024, the country should only be producing between 9.4 million and 9.5 million barrels of crude each day. OPEC, however, sees Russia dropping production from 10.85 million barrels per day in the second quarter of this year to only 10.22 million barrels per day in the third quarter. This year as a whole, we’re looking at about 10.45 million barrels per day, which would be about 69.4 million barrels of crude, in the aggregate, lower than what the EIA data suggests.
Author – OPEC Data
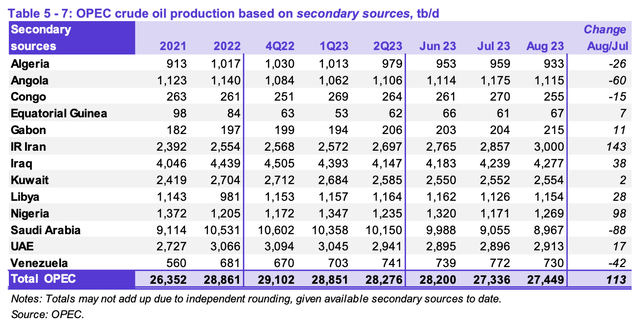
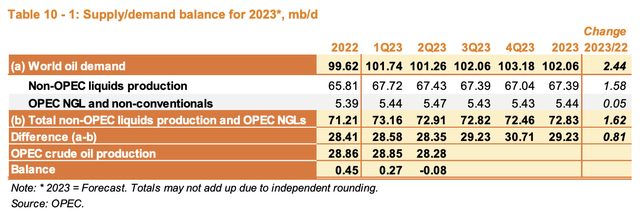
There are some other minor differences on the supply side. But the bigger differences involve demand. As an example, OPEC believes that global oil demand this year will average about 102.06 million barrels per day. That’s 1.09 million barrels per day higher than what the EIA forecasted. For the third quarter of this year, OPEC believes that its own production would need to be roughly 29.23 million barrels per day in order to match demand. But if we take data provided by the group for the first two months of the third quarter, we’re looking at an average of 27.39 million barrels per day. That translates to a deficit of 2.04 million barrels per day. That deficit is likely to grow to 3.32 million barrels per day in the final quarter of this year if OPEC production averages the same amount during that time. And with Saudi Arabia having just reaffirmed its target of keeping production lower by 1 million barrels per day through the rest of this year, that deficit is looking likely.
OPEC
If these estimates turn out to be accurate and if the historical data reported by OPEC for the first and second quarters of this year are correct, then we would be looking at an aggregate deficit of oil this year of 476.1 million barrels. While nobody knows what the future holds, the organization does think that global demand in 2024 will average 104.31 million barrels per day. And even with non-OPEC output slated to rise by 1.45 million barrels per day from 2023 to 2024, the group would need to put out 30.02 million barrels per day next year in order to avoid further shortfalls.
OPEC OPEC

As I mentioned earlier in this article, US production is higher than it has been in years. That trend also is looking set to continue. However, it could take quite a while before US output rises enough to bring prices down. For starters, as of August of this year, which is the most recent month for which we have data available, there were only 4,749 DUC wells across the major basins. This is actually down from the 5,191 reported one year earlier. To put this in perspective, in August of 2019, which was right before the COVID-19 pandemic, DUC wells numbered 8,156. The count of wells is often seen as the count of spots from which oil companies can realistically extract crude in a fairly short window of time. That’s because a sizable portion of the cost of extracting oil comes from the drilling process. So when drilling is already done, but the entire well is not completed, it can be viewed as a mechanism to quickly ramp up output. But to see the DUC well count fall so low indicates that this potential is limited. In fact, the most recent Drilling Productivity Report issued by the EIA even indicated that production across the major basins should fall, collectively, by 40,000 barrels per day from September to October.
Takeaway
At this point in time, I would say that investors probably have more reasons to be bullish on crude than they have reasons to be bearish. Yes, there are certain economic uncertainties and those could play a big role in what happens to pricing from this point on. But absent a major downturn in the economy, the existing balance between supply and demand in crude will have a much larger role in determining what happens with prices. Even though data provided by the EIA is showing a rather bearish situation, the OPEC data indicates otherwise and the market, from a pricing perspective, clearly is on its side. While some may argue that OPEC is not the most reliable source out there, my experience and looking at its data is that it tends to be quite accurate. And when you combine that with a lower DUC count, lower production moving forward in major basins, higher pricing in the market, and lower domestic inventories if we include the SPR, I would argue that the bullish case moving forward is definitely more compelling.
Read the full article here


