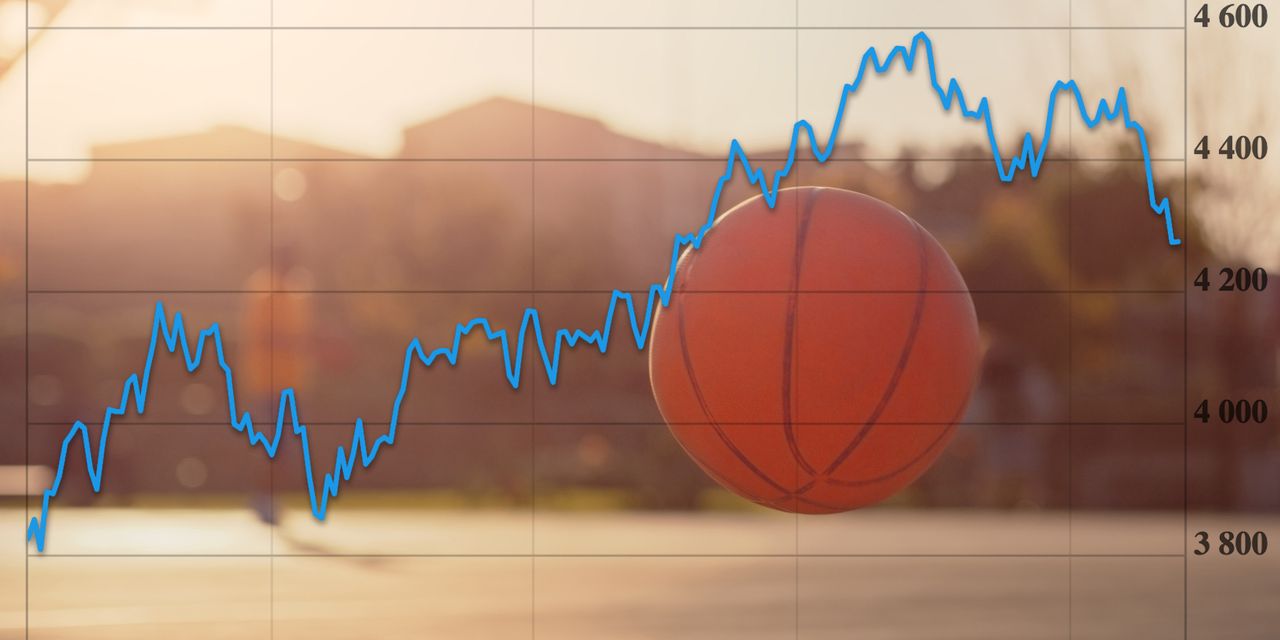
After what’s shaping up to the worst month for stocks so far this year, some investors have been zeroing in on a chart indicating a showdown is coming for the S&P 500
SPX.
Here’s the chart shared by an stock market commentator on X by the name of Heisenberg — @Mr_Derivatives:
The 5.1% drop month to date for the S&P 500 follows a 1.7% drop in August, which ended five straight months of gains. Investors have been rattled by rising bond yields as prospects of interest rates staying higher into next year have notably taken down high-flying tech stocks.
Climbing oil prices
CL.1,
and fears that consumer spending will slow, notably as student-loan payments moratoriums end, are other factors that have been eating into investor confidence. That’s as October tends to be the most volatile month of the year.
Michael Kramer, Mott Capital Management founder, said the chart represents a “major trend line off the October lows,” noting that the Nasdaq Composite has already broken with a big uptrend, “and that is bearish, coupled with a head and shoulders and diamond reversal pattern.”
The head-and-shoulders pattern often indicates a market or asset is about to go from bullish to bearish, while the diamond reversal pattern tends to indicate a trend breaking out in the other direction after an extended trend (more on that here).
His chart shows how those patterns have been shaping the Nasdaq Composite
COMP,
down 6.7% so far in September, also the worst month of 2023:
Kramer said he is not upbeat about the next big move off that trendline for the S&P 500. “If that breaks, we could see a sharp drop back to 4,100,” he said.
The strategist said he’d watch closely the climbing 30-year Treasury yield
BX:TMUBMUSD30Y
right now. “If 4.8% breaks, there is no resistance until 5.4%,” and that could portend bigger stock falls, such as the Nasdaq-100 index
NDX
dropping back to around 13,300 from the current 14,580. Here’s his chart:
Kramer said on the 10-year Treasury yield
BX:TMUBMUSD10Y,
there is key resistance at 4.69%, then no resistance when it hits 5.25%. He adds that market stress really started showing up when the Bank of Japan started altering its negative interest rate policy in July, allowing the 10-year JGB
BX:TMBMKJP-10Y
to rise to 1%. “This whole thing started after July BOJ meeting,” he said.
From July: Here’s what analysts are saying after yield curve control moves by the Bank of Japan
He also pointed to moves overseas, calling it a “global reset.” The U.K. 10-year gilt
BX:TMBMKGB-10Y
yield has moved from a low of 3.08% to 4.5%. “Additionally, i think the market is saying the Fed policy is not restrictive enough,” said Kramer.
There is a possible bright side to that “mother of all trend lines” S&P 500 chart, said The Kobeissi Letter’s Adam Kobeissi. “I’d be hesitant to say that if that trendline breaks then the entire market will collapse, but rather I see the opposite situation.
“If that trendline holds, we would prepare for the next major move higher,” said Kobeissi. But he said the near-term trend has certainly been leaning lower, as the S&P 500 makes lower lows and lower highs.
In his view, 4,200 is the most important support level for the index, as it aligns with the February 2023 high.
He thinks the technicals are looking fairly oversold, and expects “some sort of a bounce in the 4200-4250 range which may have already started yesterday to lead into 4335. A rejection of that level would form a lower high and open for new lows while breaking above that level opens for 4400,” said Kobeissi.
Others chimed in with their own chart views:
The next big test for markets may come Friday with the Fed’s preferred inflation gauge,
Read the full article here


