Thesis
KeyCorp (NYSE:KEY) is a pillar of the Midwest economy with its vast network. The banks have 972 retail branches and close to 1,300 ATMs in 15 states. The impending commercial real estate crisis poses a severe risk and highlights the precarious balance between economic stability and rate adjustments. Its credit rating downgrade does not help either. However, downgrades and the stock’s undervaluation reflect the worries of the larger market.
Despite all difficulties, KEY offers a high-quality balance sheet with lower exposure to risky assets such as CRE and leveraged financing. Another advantage is a higher percentage of short-term debt instruments, thus exploiting the inverted yield curve. Last quarter, banks’ performance suffered, but I expect to improve its profit margins in the long term. The stable noninterest income is one of the reasons to think so.
KEY offers a tiny margin of safety calculated with the Dividend Discount Model; however, it is cheaper than its peers measured with a price-to-book and price-to-sales. Given all the facts, my verdict for KEY is a buy rating.
Bank financials
KEY has an adequate balance sheet composition, given the troubled banking system. The table below shows the metrics I use to assess banks’ solvency and liquidity. The data is taken for the last financial statement.
|
Asset ratios: assets structure |
|
|
Cash/Total Assets |
3.8% |
|
Loans (total) /Total Assets |
61% |
|
C&I Loans/Total Assets |
31.2% |
|
CRE Loans/Total Assets |
13.3% |
|
Mortgages/Total Assets |
11.2% |
|
Securities HTM/Total Assets |
4.8% |
|
Securities AFS/Total Assets |
20.0% |
|
Liability ratios: capital structure |
|
|
Deposits (total)/ Total Liabilities |
80% |
|
NIB deposits /Total Deposits |
24% |
|
IB deposits/Total Deposits |
76% |
|
Long-term debt/ Total Liabilities |
12.2% |
|
Company notes/ Total Liabilities |
4.4% |
|
Equity/ Total Liabilities + Equity |
7.7% |
|
Solvency ratios: |
|
|
Loans /Deposits |
82% |
|
Cash/Deposits |
5.2% |
|
Borrowings (inc. bonds)/ Total Assets |
15.3% |
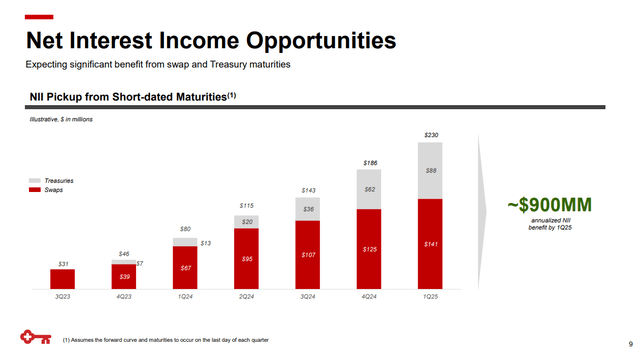
The number of HTM securities is low, which is very positive. This fact gives KEY flexibility to handle further issues caused by higher interest rates. Another important metric is the proportion of short-term and long-term debt instruments. The chart from the last company presentation below shows debt instrument distribution by maturity.
KeyCorp presentation
The swaps are 61% of the total debt instruments base. The inverted yield curve makes that composition very beneficial for KEY. Shorter maturities bear higher yields, thus increasing banks’ net interest income (NII) and net interest margin (NIM). KEY’s ability to pay dividends is directly impacted by the level of interest rates in the upcoming quarters. Hence, higher yields for longer might be good, at least for dividends.
Let’s investigate banks’ balance sheets and discuss their loan composition. The company’s strong credit quality is worth mentioning, with relatively low credit losses across the industry. Over half of its C&I loans are investment-grade, and over 70% of consumer originations have a FICO score of 760 or higher.
Earlier this month, the Wall Street Journal wrote an article titled Real-Estate Doom Loop Threatens America’s Banks. Usually, the major economic magazines are useful counter indicators for the industry’s future. They do not have a 100% success rate; however, it is higher than 50%, especially the synonym of reverse prophecies, The Economist. That said, using magazine covers as the sole indicator to make investment decisions is entirely wrong. The covers are valuable soft indicators to measure the market consensus. The latter is one of the puzzle pieces we need to complete our research. In other words, I am happy to read negative articles about the sectors I am interested in. That means I will not be late for the party. The analytical process, however, shows if there is a party.
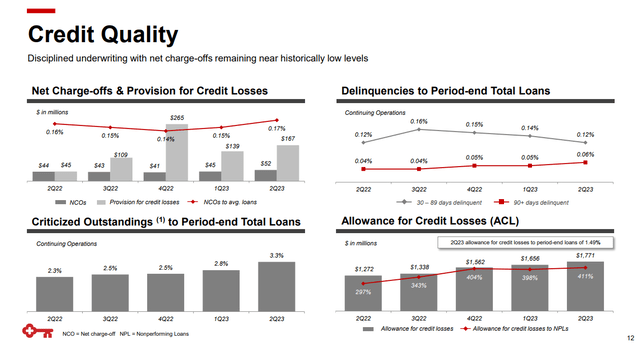
KEY maintains limited exposure to leveraged lending and B and C-class office space. In general, the company holds a meager percentage of commercial office assets. Its total CRE portfolio accounts for just 13.3% of its total assets. The table below shows credit quality by type and loan-specific metrics, such as NPL and credit allowances.
KeyCorp presentation
During 2Q23, NPL remained below 0.5%. The data above shows that delinquency rates are still at relatively low levels. The same goes for total net charge-offs as a percentage of average loans.
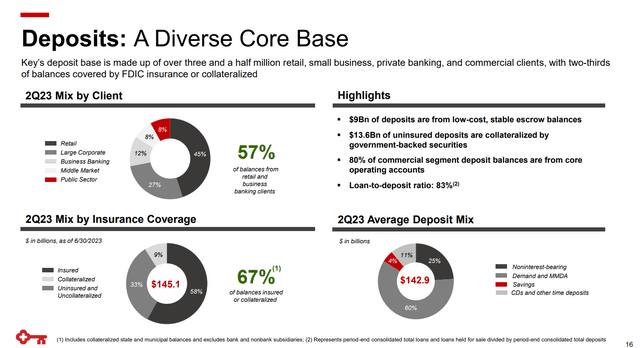
The bank’s deposit base is well diversified between various customers, as seen in the chart below.
KeyCorp presentation
Retail customers represent 47% of the total deposit base, while the second largest depositors are big corporations. Mid to large enterprises are safer customers in turbulent times such as ours. They usually have more access to liquidity; thus, they will not panic about withdrawing all their funds in case of an economic downturn.
24% of the deposits are non-interest bearing (NIB), while 76% are interest bearing (IB). The higher interest-bearing deposit expenses reduced KEY`s net NII and NIM in the second quarter of 2023. Its primary operating accounts also comprise 80% of its commercial balances.
Bank capital ratios are sufficient. The table below shows Base III metrics. The data is taken from the last financial statement.
|
Capital (in billions of dollars): |
|
|
Regulatory Capital |
20.98 |
|
Tier 1 capital |
17.3 |
|
Common equity tier 1 (CET1) |
11.84 |
|
Risk-Weighted Assets |
160.4 |
|
Basel III Ratios: |
|
|
Regulatory capital ratio (Capital adequacy ratio) |
13.1 % |
|
Tier 1 ratio |
10.7 % |
|
CET1 ratio |
9.2 % |
T1 and CET1 have improved QoQ despite the uncertain environment.
Q2 results
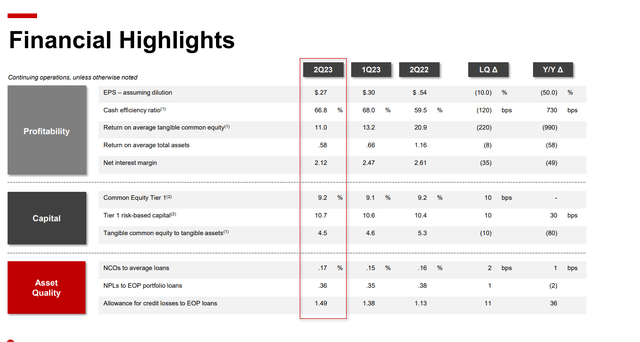
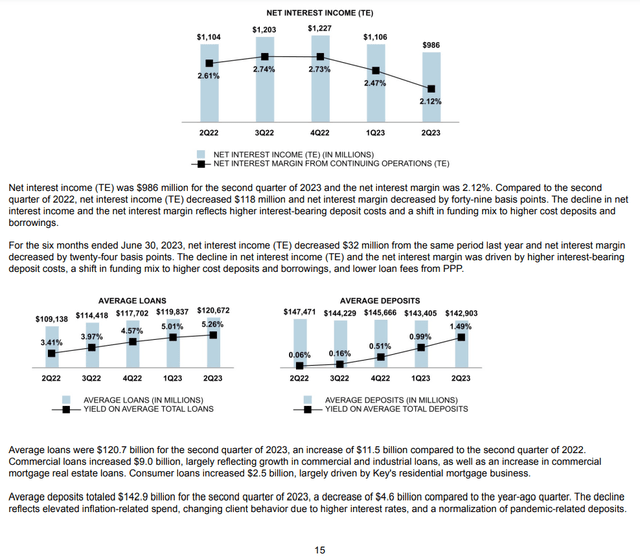
KeyCorp posted poor financial results for the second quarter of 2023, with NII falling by 11% to $986 million. KEY’s overall revenue fell from $1.7 billion in 1Q2023 to $1.59 billion in the second. The image below shows some highlights from Q2 results.
KeyCorp presentation
Despite the net income attributable to common shareholders in 2Q2023 being much lower than 1Q2023 and 2Q2022, the company declared a dividend of $0.205 per share. KEY’s net income payout ratio grew from 36% in the second quarter of 2022 to 68% in the first quarter of 2023 and then increased further to 76% in the second quarter of 2023.
The chart below shows KEY`s deposits and loans growth.
KeyCorp 2Q23 financial report
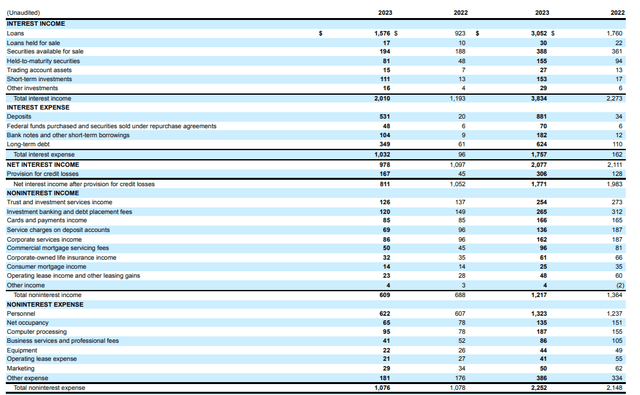
The loan portfolio realized 0.8% growth in the QoQ. However, the deposit base has dropped by 0.4%. Respectively, deposit interest has grown at a faster rate compared to loan yields. Henceforth, it adversely affects banks’ NIM and NII. KEY earned $978 million in net interest income during the second quarter. On the other hand, the bank has made $609 million in noninterest income from trust and investment-related fees. The non-interest income to interest income ratio has declined, as seen in the below table.
KeyCorp 2Q23 financial report
The noninterest income, however, has been steady, thus providing a buffer during interest rate fluctuations. Given the disappointing results from last quarter, the bank`s profitability has dropped. However, return on capital metrics are not that bad, as seen in the table below.
|
ROE |
11.68% |
|
RoTE |
13.9% |
|
RoCET 1 |
12.9% |
|
ROA |
0.79% |
ROI and ROA diverge around regional banks’ average and KEY`s five-year average values.
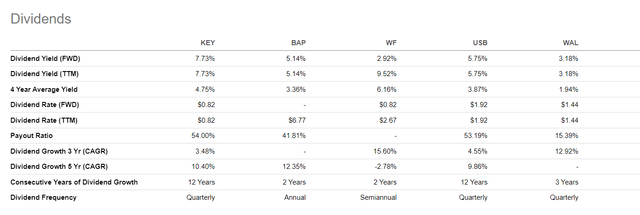
KEY distributes generous dividends with notably higher yields than its peers.
Seeking Alpha
Company Valuation
KEY has been paying insignificant dividends for the last few years. To value the company, I use the Dividend Discount Model. I follow Professor Damodaran’s framework and database.
Assumptions and inputs:
- Risk-free rate equals the 5Y average of USA long-term Government bond Rate, 2.2%.
- Growth rate, g, equals the 5Y average of the USA long-term Government bond Rate, 2.2%.
- USA’s equity risk premium is 5.0 %.
- KEY’ unlevered Beta 0.98
- KEY debt/equity ratio is 198 %.
- KEY’s effective tax rate is 25 %.
- KEY dividend (TTM) $0.82
1. Calculate Levered Beta with the formula below:
Levered Beta = Unlevered Beta * (1+D*(1-T)/E).
2. Calculate the discount rate (discount rate as the cost of equity) using the resulting value for leveraged beta. The formula I use is:
Cost of Equity = Risk-Free Rate + (Levered Beta * Equity Risk Premium).
3. Calculate the Terminal Value of dividends considering the Cost of Equity and Expected dividend growth:
Terminal Value = Dividend per share * (1 + expected dividend growth) / (Cost of Equity – Expected Dividend Growth)
4. Calculate the Present Value of Terminal Value assuming a constant discount rate for ten years.
For KEY, I get the following results:
Intrinsic value per share = $ 11.48
Current Market price = $ 10.61 on Sept 25, 2023
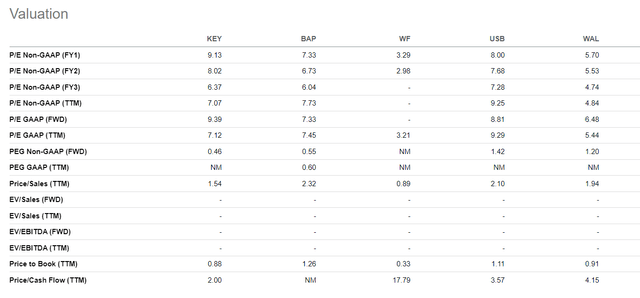
KEY offers a tiny margin of safety at its current price. Considering the quality of the bank and generous dividends at that price, it is a good deal. KEY is not expensive either compared to its peers.
Seeking Alpha
Using Price to Book and Price to Sales is cheaper than the rest. A synergy between relative valuation and company valuations offers great entry opportunities with lower downside risk.
Risks
A bank balance sheet proves its management’s ability to control credit and liquidity risks. KEY loans portfolio is well diversified across different types of borrowers, thus mitigating banks` credit risk. The declining number of risky assets as CRE deserves mentioning, too. The cash-to-deposit ratio could be better. However, higher exposure to liquid assets such as AFS and swaps plus 67% of deposits are insured, notably improving banks’ liquidity.
The market risk, I think, is already priced in investor confidence in the U.S. financial industry, which has been low since March. The WSJ article I mentioned earlier signifies the current consensus. This gives an excellent opportunity to quality banks at a discount.
Conclusion
KEY weathered the storm well while managing to keep its balance sheet healthy. Despite the disappointing figures from the last quarter, KEY has a solid income composition due to a high percentage of short-term debt securities and stable non-interest income. Those two factors will improve the bank’s bottom line in the long term. KEY offers a tiny margin of safety calculated with the Dividend Discount Model; however, it is cheaper than its peers measured with a price-to-book and price-to-sales. Given all the facts, my verdict for KEY is a buy rating.
Read the full article here


