I continue to buy the dips in the iShares TIPS Bond ETF (NYSEARCA:TIP) which now has a real yield to maturity of 2.6% before fees. This yield is completely at odds with the real economy, where slowing growth and high and rising government debt and deficits suggest real borrowing costs should be below zero. As we saw in the late-1990s, the strong equity market is forcing the Fed to remain hawkish, but once the equity bubble bursts macroeconomic concerns will come to the fore, driving real yields back into negative territory and driving the TIP up considerably.
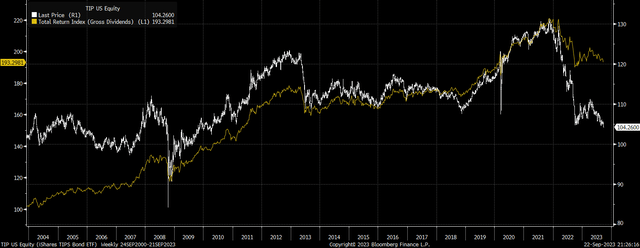
The TIP tracks the performance of US Treasury inflation-protected securities, with a weighted average maturity of 7.1 years and an effective duration of 6.6 years, which puts the TIP in the mid-range in terms of duration and volatility across the inflation-linked bond universe. The current real yield on the TIP of 2.6% is what investors should expect to receive per year over the long term after inflation, less the fund’s expense fee of 0.19%. Since my previous article on the TIP in August it has broken below its Q4 2020 lows, falling to its lowest level since 2010, with Wednesday’s hawkish Fed forecast propelling a surge in real yields across the curve. This may prove to be the move that breaks the equity bubble and allows yields to fall back in line with the real economy.
TIP Price and Total Return (Bloomberg)
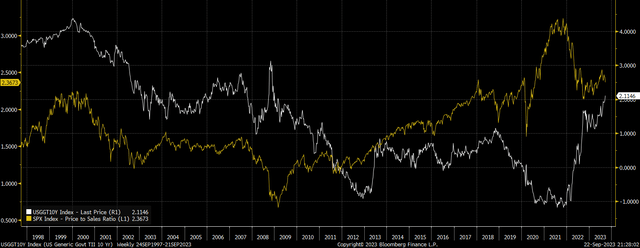
The link between stocks and real bond yields is complex. Sometimes we see economic optimism drive up both equity valuations and real yields simultaneously and pessimism drives them both lower simultaneously. This was the trend that characterized the markets from 2000 to 2007. Other times we see rising real yields weigh on equity valuations due to fears that monetary tightening will cause a recession as was the case in 2022, while other times falling yields drive up equity valuations amid a reach for yield as seen following the Covid-driven easing cycle.
US 10-Year TIPS Yield and S&P500 P/S Ratio (Bloomberg)
Real Yields Are Chasing Stocks Higher And Biting At Their Heels
Current market conditions do not fit into any of these categories. The Fed is tightening even as there are clear signs of a slowdown in real economic growth and slowing inflation. As I argued in ‘The Fed Will Ease Only After The Market Breaks‘, my take is that policymakers are concerned that any policy easing will reignite the bubble in US equity markets, potentially reigniting inflation via the wealth effect and the associated decline in money demand (commonly referred to as a rise in money velocity). This would force the Fed to raise rates even further or maintain current restrictive rates for longer.
We saw a similar trend take place in the late-1990s when Alan Greenspan’s Fed drove up the funds rate to 6.5% in 2000 even though inflation expectations remained at around 2% as concerns over equity valuations mounted. At the peak in January 2000, 10-year inflation-linked bonds yielded a staggering 4.4%. The risk is that we see US equities continue to move higher forcing the Fed to drive real yields up further.
However, in the late-1990s real GDP growth was trending at around 5% while the Conference Board’s Leading Economic Indicator index showed no sign of a recession. Today, real GDP is 2.5% and the LEI is highly recessionary. The release for August showed that the ‘three D’s’ – Depth, Diffusion, and Duration – remain consistent with a recession.
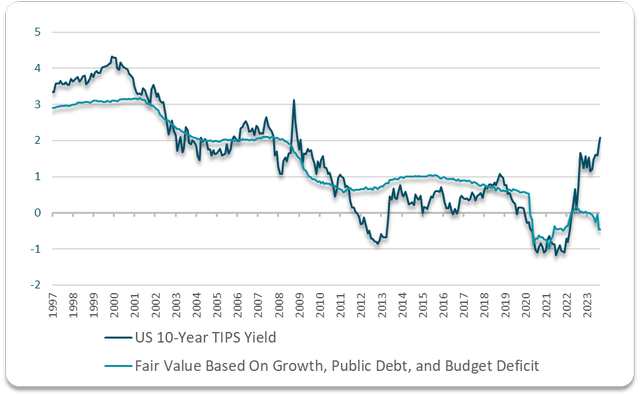
Furthermore, in the late-1990s the country’s lower public borrowing meant that real bond yields could afford to be high without negatively impacting the economy. Today, with a debt-to-GDP ratio of 120% and a fiscal deficit of 8%, high real rates pose a clear risk to government finances. The following chart shows the real 10-year bond yield relative to its fair value implied by its historical correlation with an average of real GDP growth, government debt relative to GDP, and the fiscal deficit. These variables suggest 10-year real yields should be around -0.5%, making the current yield of 2.1% almost four standard deviations above its 20-year average.
Bloomberg, Author’s calculations
The recent equity weakness seen following Wednesday’s Fed meeting suggests the market may have already peaked and I expect further losses to allow the Fed to shift its focus towards preventing a deep recession and fiscal crisis. This was the case following both the 2000 and 2007 market peaks and resulting in significant outperformance in the TIP.
Deflation Is A Risk But Would Further Improve Long-Term Outlook
An additional risk to the TIP comes from a collapse in inflation expectations should the Fed be successful in driving down risk asset prices. As we saw in 2008 and 2020, equity market panics can undermine the TIP as deflation fears cause real yields to rise even as nominal yields fall. However, with an expected real yield of 2.4% after fees, the rewards far outweigh the risks. The relatively low duration of the TIP’s holdings means that even another 1 percentage point rise real yields would result in a loss of just 7%. Furthermore, any deflationary pressures would likely be quickly fought against by the Fed and Treasury, further raising the likelihood of a move in real yield back below zero, which would imply around 17% upside for the TIP.
Read the full article here


