Stocks have fallen sharply since the middle of July, and the declines may not be over. Major indices like the S&P 500 (SP500) are on the cusp of breaking significant technical support levels, as the fantasy yearning for rate cuts is becoming the nightmare of higher for longer.
While it may not have seemed like it, it appears that this recent implosion in stock prices potentially confirms that the summer rally may prove to be one of the biggest bull traps in 20 years. Everything is starting to fall apart as rates and the dollar surge on the back of a stronger US economy, increasing oil prices, and more persistent inflation.
Stocks mispriced or decided to ignore everything behind the scenes because investors wanted to believe that the no-inflation world of the past 15 years was coming back. That has come back to bite as rates have exploded to levels not seen in at least 16 years. This has left the stock market in a dangerous position as financial conditions tighten, compressing earnings multiples. Stronger economic growth and above-trend growth will pressure the Fed to remove more rate cuts from the equation and raise rates further, especially with the market screaming that monetary policy is not restrictive enough.
Poised To Break
Now, the S&P 500 is sitting on a critical level of technical support at 4,320, which is essential not only from a short-term standpoint but also from a long-term one because that 4,320 is also the August 2022 high. A break below that price would leave many investors wondering if the entire “bull market” run was a trap on a failed break-out attempt. A breakdown from here probably sets up a retest of the 200-day moving average of around 4,190.
TradingView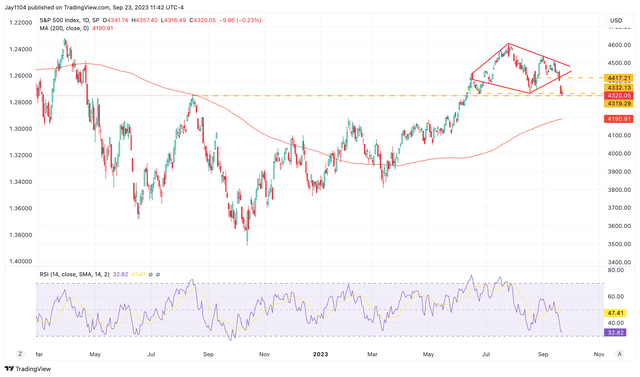
The chart below also displays a diamond reversal pattern, suggesting that the S&P 500 falls back to roughly 4,150 and below the February 2 highs at around 4,200.
TradingView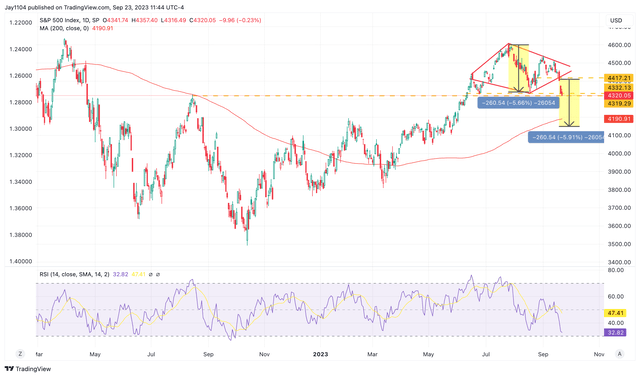
Option Positioning
But more is at play this week because the JPM Collar options contract expiration date will be Friday. The collar is a three-part zero-cost option traded once every quarter as a hedge trade for the JPMorgan Hedge Equity Fund. One of the big open positions is a put position at 4,210. That level is significant; if the S&P 500 breaks support this week at 4,320 and starts heading lower, that 4,210 level will act as a magnet, drawing the S&P 500 index towards it as the gamma for the put increases in value.
Bloomberg
Stocks Ignored The Risks for Higher Rates
These are only short-term factors in nature. The real underlying issue driving the move lower in the market has been the massive move higher in rates on the back of the yield curve. This is something that the entire equity market has ignored over the past few months. The equity market had been fixated on the potential for multiple rates coming not only in 2024 but also in 2023, and based on the latest Summary of Economic Projections (SEP), it is just not going to be the case.
But forgetting about the Fed rate cuts, the most critical piece of information, and perhaps the most damaging from the Fed meeting this week, was acknowledging the potential of a higher neutral rate or R*. This is illustrated through the SEP and was brought up twice during the press conference. Even market pricing acknowledges that the neutral rate is higher than the Fed’s long-run projections of 2.5%. The Feds Fund Futures curve shows rates not falling below 4% anytime over the next five years.
Bloomberg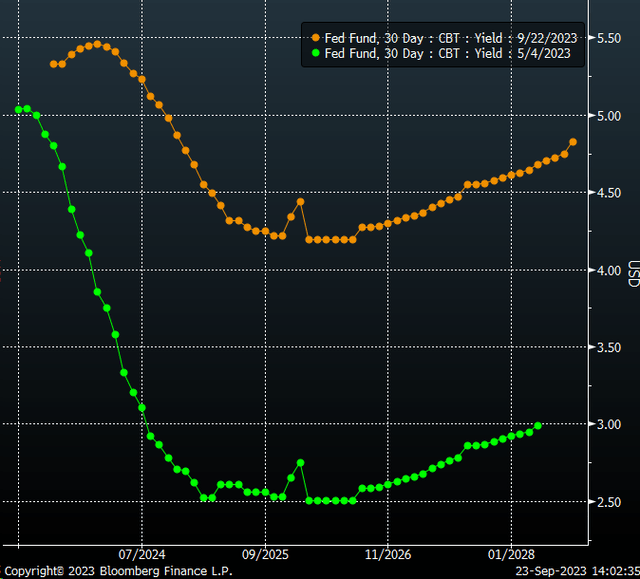
This is the most critical piece of information because it tells the equity market the days of 0%, and even ultra-low interest rates and big QE programs of the past are likely dead, barring some economic catastrophe, which everyone can agree would not be desired. Even back in May, Fed Fund futures saw rates falling to 2.5% as early as 2024 due to regional bank stress, and that led the equity market to rip higher because everyone thought the Fed was done hiking rates; everyone wanted to get in front of the rate-cutting cycle.
Then, the economic data started improving, and the bond market began to reprice rates higher. If the stock market had been watching the economic data and listening to the Fed officials, it should have been crystal clear that the economy was doing better than feared, and the rate-cutting cycle was a long way off and not likely to be very steep once it arrived.
The Rally Never Made Sense
The entire summer rally was bizarre from the start, happening at the same time that rates started to rip higher. Which, of course, unwound a relationship between real yields and the stock market that had been in place for years. The TIP ETF plunged as real rates rose, and instead of the QQQ ETF falling along with the TIP, it went higher, creating a massive divergence.
TradingView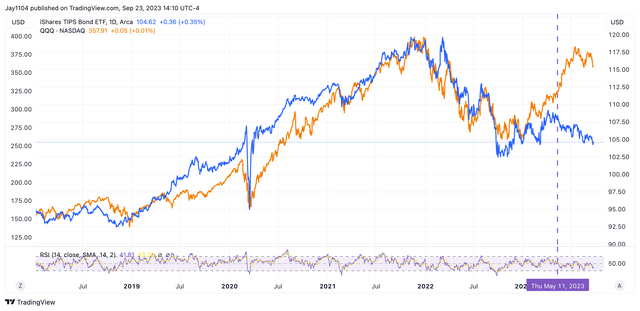
Again, it looks evident at this point: the entire rally was driven by a short-volatility trade that is unwinding and likely still has more to unwind because being short-volatility in an environment where rates are rising, credit spreads are widening, and the dollar is strengthening is not the place one wants to be. This has resulted in the VIX index, the 1-Month implied correlation index spiking this past week, and the CDX high yield spread index.
Bloomberg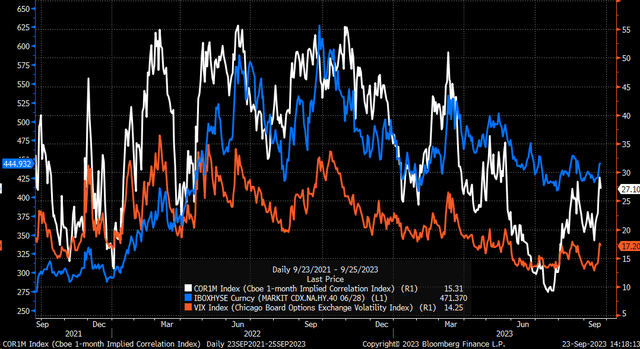
It would seem that on the surface, at least, everything that led to the rally starting in mid-May is now unwinding, reflected in the technical patterns. As noted once, this could turn out to be one of the biggest bull traps in 20 years, and it sure seems like that is precisely what is happening now.
Read the full article here


