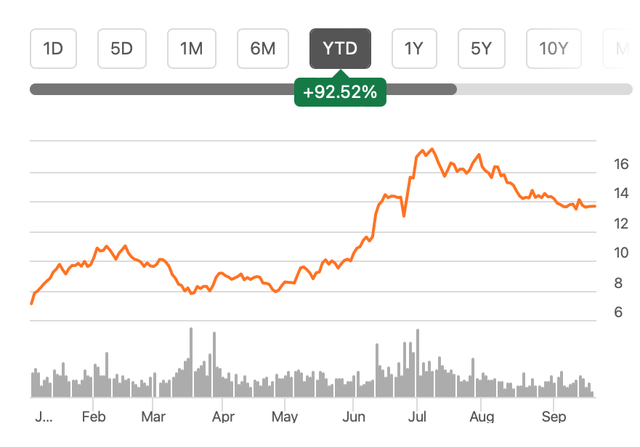
Since the last time I wrote about cruise company Carnival Corporation & plc (NYSE:CUK) in early July, its price has dropped a 20%. On the face of it, this flies in the face of my Buy rating on the stock.
But the caveat to the call, is that, it was from a medium-term perspective. Moreover, the stock is still up by 92.5% year-to-date [YTD], so some profit-taking was in order. With its third quarter (Q3 2023) results expected later this month (estimated September 29th), here I take a look at how the stock could respond next.
Source: Seeking Alpha
A look back
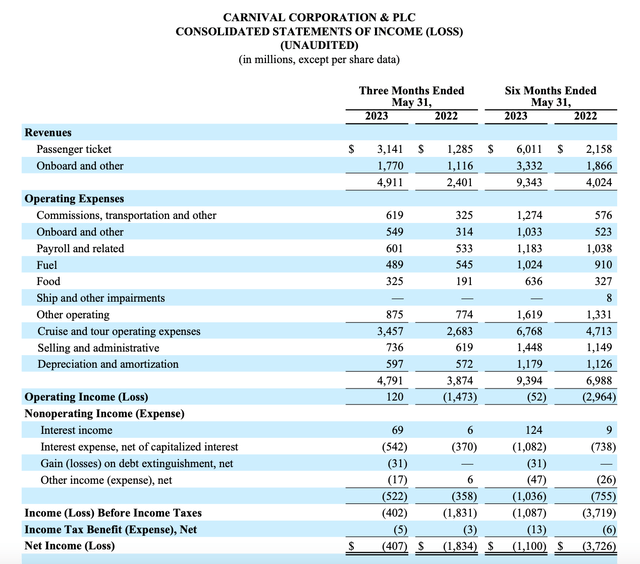
At the time I last wrote, the company was fresh from its Q2 2023 earnings report, which was littered with the following positives and formed the basis of my rating.
- Rising travel demand from its big U.S. market and increased prices resulted in a more than doubling in revenue from Q2 2022.
- The company also saw improved gross margins, its first operating profit since the pandemic and the net loss shrank too.
- The debt-to-assets ratio looked alright at 0.7x as well.
- Forward estimates indicated that the company could become profitable on a net basis from Q3 2023 onwards.
- Both its trailing twelve months [TTM] and forward price-to-sales (P/S) ratios were competitive compared to peers.
Source: Carnival Corporation
What to expect in Q3 2023
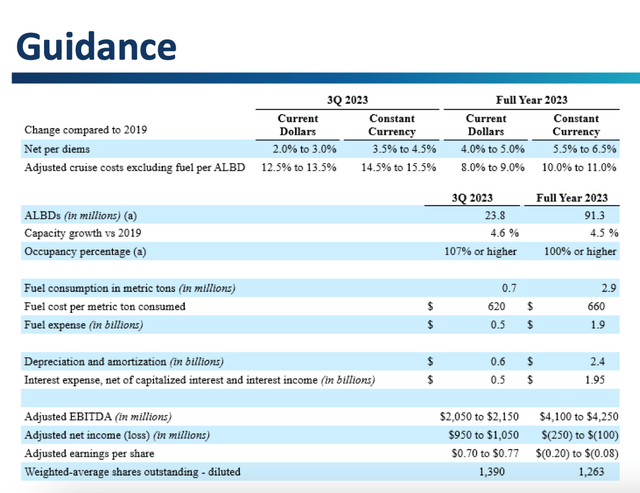
I had touched upon the prospects for Q3 2023 briefly the last time. Here, I explore it in detail. First, let’s look at the company’s own forecasts. It expects improved occupancy rates of 107%, compared to the 95% levels seen in the first six months of the year (H1 2023).
It also sees adjusted EBITDA to come in in the range of USD $2.05-2.15 billion, a massive improvement over the USD $300 million in Q3 2022, when it had first turned positive again. It also expects to finally report a positive net adjusted income after being in a loss even until the last quarter.
Source: Carnival Corporation
From a stock perspective, I believe that the key number to focus on is the occupancy rate since it ties in with revenues and from there, the P/S. Even if the company does report a profit in the latest quarter, on a TTM basis it would still be loss making so the price-to-earnings (P/E) doesn’t enter the equation.
Calculating occupancy rates
How the company expects occupancy rates at over 100% bears some explaining. The occupancy rates are calculated as passenger cruise days [PCDs] as a proportion of the average lower birth days [ABLDs]. PCDs are the sum of the total number of days for which each of the passengers is on the cruise.
ABLDs are the total capacity of the cruises for the time they are in operation in a period. In making this estimate, the company assumes two passengers per cabin. However, some cabins allow for more than two passengers, which means that technically, occupancy rates can rise above 100%.
Since the past quarter of June-August for Carnival Corporation was actually tourist season, and travel in the U.S. market picked up by 12% year-on-year (YoY) in July, indicating that the company’s projections may well be accurate.
What revenue growth can come off
This in turn is an encouraging indicator for revenue growth. It’s further supported by the 2.8x YoY revenue rise during H1 2023. However, the extent of the revenue jump is unlikely to be as much. Here’s why.
In H1 2022, the occupancy rates were still relatively muted at 62%, so the scope of growth was higher. And indeed, that happened, with a 33 percentage point increase to 95% occupancy rates in H1 2023. However, in Q3 2022, the rates were already at 84%. So even with a 107% rate in Q3 2023, the rise is by a lower 23 percentage points.
Estimating revenues
In estimating revenues, I’ve assumed that: (a) the occupancy rate comes in at exactly 107% in Q3 2023; (b) the ABLDs remain constant from Q2 2023 at $22.3 million, which is already higher than the 21 million in Q3 2022; and (c) the revenue per PCD stays at USD $225.3, the same as in Q2 2023.
These assumptions resulted in PCDs of $23.9 million in Q3 2023 and a total revenue of USD $5735 million. This is a 24.9% YoY increase, which is a significant come-off from the growth in H1 2023. But it’s a conservative estimate. Considering the tourist season, the occupancy rate, PCDs and revenue per PCD are likely to be higher. In fact, analysts’ estimates put revenue growth at 55.3%.
The market multiples
My estimates result in a far higher forward P/S of 1.2x compared to 0.9x for other analysts. It’s also slightly lower than the average for its peers Norwegian Cruise Line Holdings (NCLH) at 0.9x and Royal Caribbean Cruises (RCL) at 1.8x, at 1.3x.
Normally, I would go with only my own estimates. But considering that they are conservative, in this case, I believe the average of my own P/S estimate and that by other analysts gives a better picture. This results in a forward P/S of 1.1x, which gives a small upside to the stock even right now.
The TTM P/E at 1.1x is slightly higher than that for NCLH at 1x and much lower than that for RCL at 2.1x, making it definitely lower than the 1.55x average for peers. This, too, the likelihood of a price rise.
What next?
To me, this analysis shows that nothing has fundamentally changed for Carnival Corporation since I last wrote about it. If anything, it reflects continued revenue growth, even if at a lower rate. The market multiples may well look far more attractive if revenues end up beating estimates, which can’t be ruled out keeping in mind the recent buoyant travel season. If it is indeed able to report net profits as well, that can only further boost the stock. I’m reiterating a Buy rating on Carnival from a medium-term perspective.
Editor’s Note: This article discusses one or more securities that do not trade on a major U.S. exchange. Please be aware of the risks associated with these stocks.
Read the full article here


