Small stocks underperforming
Here are some facts about the Russell 2000 index or the small cap stock index, as proxied by the iShares Russell 2000 ETF (NYSEARCA:IWM):
- Over the last 5 years, IWM is up by just above 7%, while S&P 500 (SPY) is up by over 53% over the same period.
- Over the last 12 months, IWM is almost flat with gains of 0.9%, while S&P 500 is up by almost 14%.
Consider what happened over the last 5 years, and zoom in and consider what happened over the last 12 months to explain this relative underperformance of small stocks IWM, relative to the stock market benchmark the S&P 500.
- The super-sized monetary and fiscal stimulus post Covid-19 pandemic clearly benefited the stocks carrying the major weight in the S&P 500, but with no major impact on small stocks.
- The 2023 soft-landing narrative (or fantasy) has not impacted the small stocks.
- The 2023 AI-themed exuberance boosted the magnificent 7 tech mega-caps, which account for almost 30% of the S&P 500, but this this not affected the small cap index.
Based on the recent history, we understand what moves the S&P 500, and especially the megacap tech stocks within the index – it mostly the market liquidity.
The post-pandemic stimulus boosted liquidity and thus caused the “speculation fever” in major tech stocks. Similarly, the 2023 soft-landing narrative was really based on temporary liquidity boost after the March banking crisis, as the Fed interrupted the QT with temporary balance sheet expansion.
What moves the small stocks
So, what moves small stocks, in this case specifically the Russell 2000 Index?
The portfolio investment theory views the S&P 500 (SP500) (SPX) as the benchmark “market portfolio” with the Beta of 1 – this is the measure of systematic risk. So, the S&P 500 is the proxy for the market risk, and this included all macro variables, such as monetary policy, fiscal policy, geopolitics…
Within the same portfolio investment theory, the Russell 2000 is considered as a high-risk investment with the Beta above 1, or riskier than S&P 500.
Further, given the key prediction of the Capital Asset Pricing Model, the riskier investments (with higher Beta) should have a higher rate of return. Thus, as a riskier investment, the Russell 2000 is supposed to have much higher rate of return relative to the S&P 500, over time, and over the business cycle.
So, let’s explore this specific idea further – based on the business cycle investment strategy, the Russell 2000 is supposed to be a leading indicator.
In other words, in the early business cycle, investors should increase the Beta of their portfolios to maximize the rate of return. At the same time, in the late cycle, investors should reduce the risk in their portfolios – sell high Beta investments such as Russell 2000, and buy low beta investments, usually the large cap and defensive sectors. Thus, the Russell 2000 can be view as a leading indicator for the broader market performance.
IWM as a business-cycle leading indicator
So, what makes the Russell 2000 an accurate proxy of the business cycle
- First, small stocks within the Russell 2000 are exposed mostly to the US domestic economy, their international exposure is minimal (unlike the companies within the S&P 500 which have a heavy international exposure with nearly 50% of sales generated from abroad).
- Second, a large percentage of companies within the Russell 2000 are not profitable, and heavily leveraged. Thus, the debt cycle within the business cycle disproportionally affects small stocks – the end of a business cycle causes more widespread defaults within the small cap space.
Thus, the Russell 2000 is going to be more sensitive to the US economy, and thus more useful as a leading indicator of a US recession, and the US credit cycle.
So, what is Russell 2000 signaling now?
This is not a technical analysis article, but the price action is important to follow to be able to evaluate how market participants are positioning in Russell 2000.
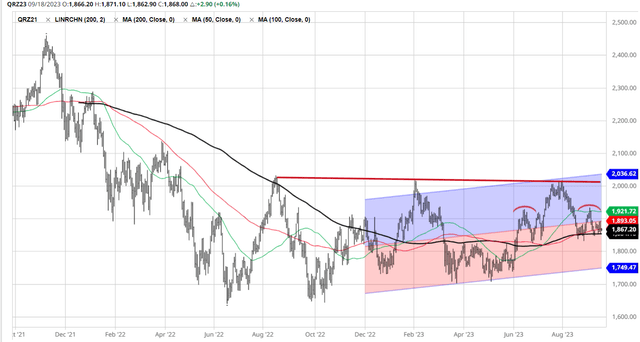
The chart below shows that Russell 2000 bottomed out in June 2022, well before the S&P 500 which bottomed out in November. 2022. However, the initial rally to the 2000 level has been met with renewed selling into the November double bottom (as the S&P 500 reached the new low).
The subsequent January 2023 rally took the Russell 2000 back the previous high just above the 2000 level, but the March banking crises caused another wave of selling, which stopped just above the June/November lows. The June/July rally (the AI-themed megacap rally) took the Russell 2000 back the 2000 level, which failed once again as the AI-theme faded.
So, now we have a triple top on the Russell 2000, with the 2000 level as the major resistance. The latest selloff took the Russell 2000 to the key support at the 200dma (black line). After the initial support held and a brief rally (in response to weaker JOLTS data), Russell 2000 sold off back to the 200 DMA resistance. Thus, currently we have a head-and-shoulders pattern, with Russell 2000 sitting right at the neckline. Once the 200dma support is broken, and at the same time the “neckline” is broken, the Russell 2000 is facing a major breakdown.
Barchart
Implications
Technically, the Russell 2000 is facing a major breakdown. Fundamentally, this is signaling a US recession, as the Russell 2000 is a high-beta investment, cyclically sensitive to US business cycle and debt cycle.
Given the inverted yield curve, the US recession is inevitable, and the Russell 2000 has been reflecting this. The S&P 500 has been misleading investors in believing into the soft-landing narrative, the Russell 2000 is telling the real story.
Alternatively, if this time really is different, and the US economy avoids a recession, and we are at the beginning of the new cycle, the Russell 2000 is the place to be, a major move up is pending – once the 2000 level resistance is broken.
However, I believe we are facing a recession, and I see the Russell 2000 breakdown as more likely, and thus positioning for a downturn – broadly in the more overvalued sectors.
Seeking Alpha reports a very high short ration for IWM, with over 30% of shares outstanding short. This confirms that the market participants also view IWM as vulnerable, but at the same time exposes the shorts to the short-squeeze risk.
Seeking Alpha
Some IWM facts
Looking at the sector representation within IWM, Technology, Industrials, Health Care, and Financials carry around 15% of the index each, for just above 60% of the index, so IWM is well diversified.
Seeking Alpha
Given that many companies within the Russell 2000 index are not profitable, it’s difficult to observe the relative valuation based on the PE ratio. The Wall Street Journal reports that Russell 2000 is trading at PE ratio of 26, which is expensive.
The wall Street Journal
Read the full article here


