The only purpose of Safehold (NYSE:SAFE) is to grow a portfolio of ground leases and to profit from doing so. Safehold owns the land and leases it to some commercial enterprise via a ground lease.
Their ground leases are like supercharged long bonds. Long bonds typically feature a fixed coupon that is paid out for a very long time. As a result, when interest rates and hence discount rates rise, the Net Present Value, or NPV, of long bonds drops substantially.
The Safehold ground leases have escalating coupons. The escalators include both a fixed component, nominally 2%, and a CPI-lookback adjustment that will capture much of the price inflation. The CPI-lookback adjustment may be significant over the decades, but we ignore it here for simplicity.
Let’s compare the decrease in NPV of a long bond with that of a ground lease (or bond) having 2% escalators on the annual payments. Suppose they have the same NPV when the relevant discount rate is 3%. This is the decrease in NPV as discount rate increases:
RP Drake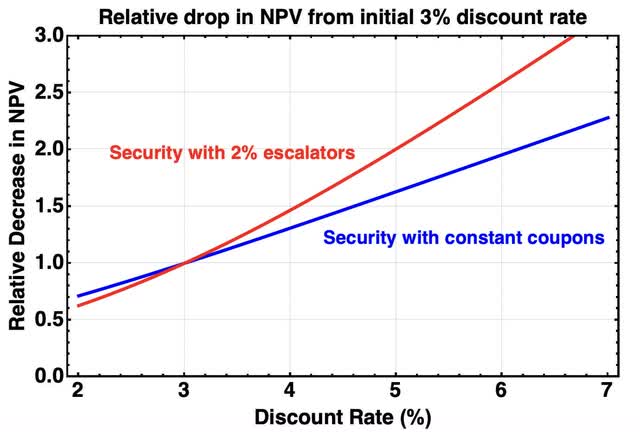
For an increase in discount rate from 3% to 5%, which is what we have seen for AAA bonds, the NPV of such bonds drops about 1.6x. In contrast, the NPV of the security with the escalators drops 2x. If the comparative result does not seem obvious to you, then my recommendation is that you go figure it out before reading further.
The Safehold ground lease payments are extremely secure. If one valued them at a 3% discount rate in early 2022, as Safehold advocated and with which a number of analysts agreed, then their NPV (and the SAFE price) should have dropped 2x from there to here.
Instead, the price of SAFE has dropped 3.5x. But the company did not collapse, as one might see for such a large price drop.
Instead, they have grown their portfolio and internalized their management since. And their cash flows will grow steadily from here.
With this price action, either SAFE was overvalued in early 2022, or it is undervalued now, or both. Here we look at the valuation today, with some new perspective as is described below.
I describe Safehold as a RINO (REIT In Name Only) because they do not own any revenue-generating components of real estate.
As a result, they have near zero operating expenses and zero capital expenses. These facts will matter when we get to the discount rates that apply to their assets, later on.
The present article does not discuss the recent announcement of an equity raise by Safehold. I discussed here why it is very likely to be accretive to per-share Net Present Value, or NPV. So far, they have made an accretive use of those funds by paying down some high-rate revolver debt.
Current or near-term cash flows, which I discussed here, are also not our focus today. We will be concerned with long-term revenues and costs and what these are worth. We briefly discuss other aspects that add value below.
I had also hoped to include material on valuing the much-maligned Caret units, but this article is too long even without that. That material is available here.
My main focus today will be the value and future of the current portfolio, as of June 30, 2023.
The Safehold Portfolio
Since Safehold has $6.2B spread across their 134 leases, the average value of land plus buildings exceeds $110M. These are big buildings or developments.
Until 2021, Safehold did not have an investment-grade credit rating and had to rely on mortgage debt. The properties acquired before that have non-recourse mortgages.
The properties acquired more recently are unencumbered and the more recent debt is unsecured. Today their credit ratings are BBB+ or equivalent, with positive outlooks.
The current portfolio is distributed across the top 30 MSAs in the US and a few more locations. It includes 15.5 Msf (million square feet) of Multifamily, 12.6 Msf of Office, and 5.8 Msf of Hotel, Life Science, and Other.
Here is the distribution of the total assets and the unsecured assets. In the table “GLTV” is Safehold jargon for Ground Lease To Value, unrelated to LTV for the Loan To Value ratio.
RP Drake
With GLTV targeted at 40% and debt targeted to be 2/3 of that, the ratio of loans to total property value runs near 25%. Quoting Investor Relations:
… the 25% look-through LTV is a significant reason we’ve been able to procure attractive debt over the years. The lender’s look-through LTV is very low which gives great comfort on a principal basis, and key income-based ratios for lenders such as debt yields and interest coverage ratios improve dramatically from our compounding ground rent increases.
Safehold shows this comparison with typical asset-backed securities. The location in the capital stack of the Safehold ground leases is analogous to that of the AAA stack for Asset-Backed securities.
Safehold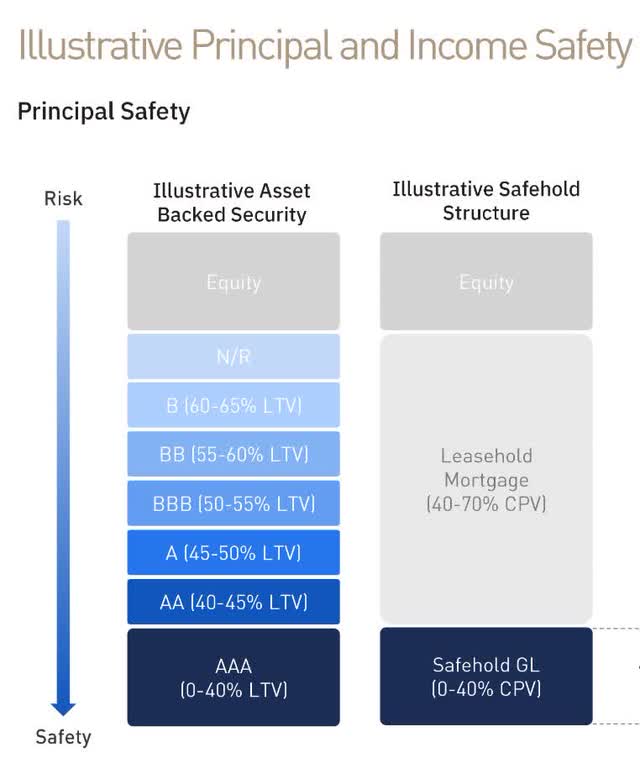
While one could push the analogy too far, the results from S&P Global about that AAA tranche seem worth noting. For U.S. Asset Backed Securities, the default rate of the AAA tranche was zero from 1986 through 2020 and the AA tranche was only non-zero in 2002. More broadly, for US structured credit overall one has this:
RP Drake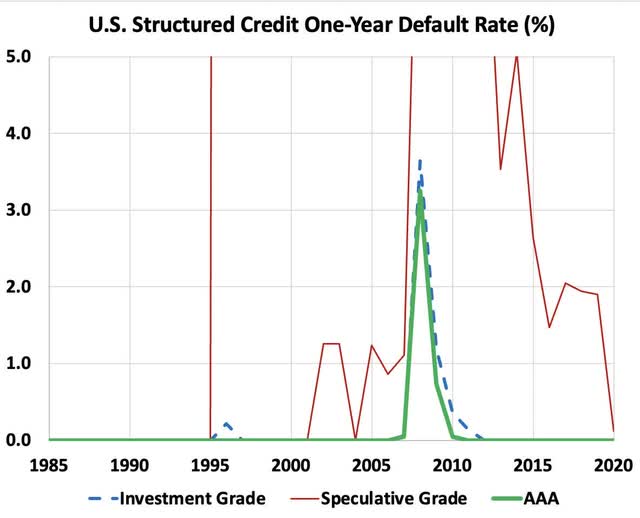
Now a period like 2007 through 2010 may well be a once-in-a-century event. But suppose it happens once every 20 years. The analysis below uses 10-year cumulative default rates. Such a rate of 1.8% is consistent with 3% losses over 20 years.
For comparison, that is better than an A- performance for corporate bonds. We will tie this back in later.
Comparison to Equity REITs
Equity REITs provide a more direct comparison that highlights the relative security of ground leases. Challenged periods in property markets lead to significant decreases in Net Asset Value. This has consequences for stock prices as we have been seeing lately in Office REITs.
The debt of those REITs is low risk, typically being at 40% Loan-To-Value, but they are exposed to 100% of any declines in property values. In contrast, the Safehold equity is only exposed to declines in value above 60%. We illustrate this here:
RP Drake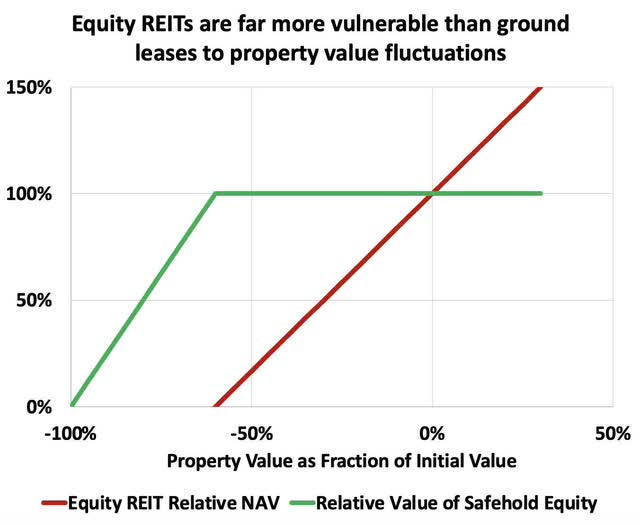
The red curve shows the NAV for an equity REIT that operates at a typical LTV of 40%. As Property Value (shown on the abscissa) drops, NAV drops with it, going through zero at a drop of 60%. The curve for a typical private-equity-funded building, with its higher leverage, is steeper.
This red curve provides part of the explanation for why typical REIT stock prices are so volatile. The drop in NAV is nearly twice the drop in property values.
The green curve shows the value of the equity tranche Safehold owns, at 40% of the initial Property Value. The associated debt is unsecured and independent. (Under most conditions, the Safehold ground lease is worth more than the initial value of the land, but for simplicity, we ignore that here.)
The value of that ownership tranche remains the same until the Property Value has dropped by 60%. A modest drawdown in Property Value can produce a severe hit to the NAV of an equity REIT but leave the value owned by Safehold unaffected.
[Note: in general I am not a fan of NAV for equity REITs, as NAV cannot be established with good accuracy. The secure and very long-term cash flows of Safehold make NAV more certain for them, but one still has the uncertainty discussed below related to what actual default rates will be.]
Quality of Ground Lease Income
I was fortunate to have the opportunity recently to have a lengthy and fruitful discussion with Julian Lin, an author who has long questioned the valuation of SAFE by me and others. I thank him for taking the time for that.
Our focus was on trying to understand why we saw SAFE so differently. One takeaway for me was that the question of the actual credit quality of the ground leases Safehold writes is foundational to establishing value.
Green Street has expressed the opinion that the quality is at the AAA level. Julian was having none of that (as I understood him). Let’s explore this subject.
While the ratings agencies use many criteria in assessing credit quality, the bottom line result is a default rate. Let’s look at how that occurs for ground leases, before considering the implications of various possible rates.
The path to default
Some readers point to an example, like this one, where a building sells for less than 60% of its earlier value, and then seem to think they have disproven the Safehold model. The thing is, while one counterexample is sufficient to disprove a proposed Law of the Universe in physics, nobody is claiming that Safehold will see zero defaults.
Ending up with a ground lease default is a multi-step process. The context is that there is a tenant of Safehold who owns the building on the land and a lender for that owner. Typical numbers for a $100M building would be a $40M ground lease, a $36M loan, and $24M of equity invested at 60% leverage on the building.
By far the most common origin of defaults is an inability to refinance at the present loan value. This happens only when a mortgage becomes due.
Quoting a recent article regarding a note from Moody’s:
CompStak, an American lease data provider cited in the report, indicates that the average office lease still has 5.1 years remaining on it. In other words, the higher market vacancy rates and lower rents will not be reflected in specific office cash flows for some time.
The fact that loan terms are at least several years greatly reduces the fraction of properties that have issues refinancing each year so long as times are bad.
So the first step toward ground-lease default is that the value of the building is depressed when the loan matures so that the owner would have to invest more equity to get back to 60% leverage.
The owner chooses not to invest the additional equity to roll their loan. But that is only sometimes final. Quoting
… commercial real estate attorney Natalia Sishodia said … she had at least three clients in the city ready to hand over their buildings to lenders, but they did not in the end after working out compromises with the banks. “If they don’t they would end up with this commercial spaces and this is not something banks really want to do,” she said.
That said, we have seen the keys to some high-profile, class-A buildings handed back to the lender by Brookfield and other prominent investors. Some owners will not be able to make satisfactory deals with their lenders.
In such cases, the lender will attempt to sell the building at an economically sensible price to a new owner. They might want concessions on the ground lease rents and might get them. That aspect is ignored here but could be allowed for by using a somewhat higher default rate below.
If the value of the total property has dropped 60%, more or less, then the lender will hand the keys to Safehold and walk away. At that point, Safehold will have a paper loss on the property.
If this were to happen too often, lenders would likely begin to charge higher rates on buildings with ground leases, in response to the risk. Increased interest payments on the building loan would not change the main advantage of ground leases, which is reduced capital requirements, producing increased return on equity. A quantitative example is found here.
Now go back to our property in default on the ground lease because of a collapse in market value. My guess is that Safehold would then sell the property for whatever they can get and book the loss (for the typical unencumbered cases).
We look at models of the loss of revenue from defaults below. In addition, the loss of the property will impact their overall ratio of unencumbered assets to unsecured debt. The covenants on the Safehold credit revolvers require that they maintain this ratio above 1.33.
Today the ratio is near 1.8. Even supposing that Safehold had 10% of their properties default during some extreme national crisis, it would only decrease to about 1.6.
It is default rate that matters
Some readers also say dire things about class-B and class-C office buildings today, as though this guarantees that the Safehold ground leases will fail in huge numbers. In contrast, other readers, aware of the steps just described, offer the opinion that such defaults will be quite rare.
You have to make up your own mind about likely rates. For your consideration here is a recent discussion from Joseph J. Ori, the Executive, Managing Director of Paramount Capital Corp., a CRE Advisory Firm, reported by GlobeSt. and worth quoting at length:
The CRE industry has been dealt a big blow with eleven interest rate hikes since March 2022 and a federal funds rate that jumped from 0.0% to 5.25%. The average CRE property’s value has slid by about 25% due to [the resulting] higher cost of capital. This is a risky situation for the industry; however, it does not mean that the CRE market in the U.S. will crash, similar to the Great Recession, which lasted from 2007 to 2012 when property values were down 50% on average.
Even though values are down, most properties are still generating enough cash flow to pay the annual debt and other costs like tenant improvements, leasing commissions and capital improvements. Most of the properties that are in distress were purchased at ultra-low cap rates during the last few years or are located in the high-crime Gateway cities with high vacancies and outmigration of businesses. Many of the buyers of these properties used floating rate debt to acquire the property without any interest rate protection by using an interest rate swap or rate collar. The rapid increase in interest rates since March 2022 has made it extremely difficult for these owners to cover the annual debt service on the property. Currently, the majority of distress in the CRE industry is concentrated in office properties located in the Gateway cities and buyers who overpaid and did not prepare for the interest rate risk from the use of floating rate debt.
However, the overall distress in the CRE market is not at dangerous levels as many pundits have been claiming during the last year. There is a total of $4.5 trillion in CRE loans outstanding per the Mortgage Bankers Association of America, of which the commercial banks/thrifts own 38% or $1.7 trillion. The distress level today is only about 2.0% of the total loans outstanding or $90 billion, which is a cause of concern, but not Armageddon as many have claimed. If the Federal Reserve does increase the federal funds rate further from 5.25% to between 5.50% and 6.0%, then I believe the default rate will double to 4.0% or $180 billion, a significant number, but still not a crash or CRE depression. There will be hundreds of properties in default but not enough to create an economic crash. During the Great Recession, the default rate for CRE loans was over 10.0%, which was a secular crash in the industry.
(There is some ambiguity around the meaning of “CRE” in that quote. Green Street found the decrease in average property value across all sectors during the Great Recession as about half that quoted above.)
We should emphasize again that a default on a standard CRE loan does not imply a default on the ground lease. Most of the time it will not.
In addition, Safehold targets “infill locations that sit within economic, technological, educational, and cultural centers.” The implication is that default rates will be smaller than those one would see from randomly distributed properties.
Context from Bonds for Defaults
Per Moody’s, the ten-year cumulative default rate for AAA debt has been 0.68% over the past century. Compounding this the default rate for a 99-year lease is still less than 7%.
This would correspond to about 10 of the current 134 ground leases that Safehold has. That is a rate of about one per decade.
In contrast, the default rate corresponding to BB+ bonds is 8.5%. That would imply about 11 per decade of the current 134. Here is a table of current data spanning relevant credit ratings:
RP Drake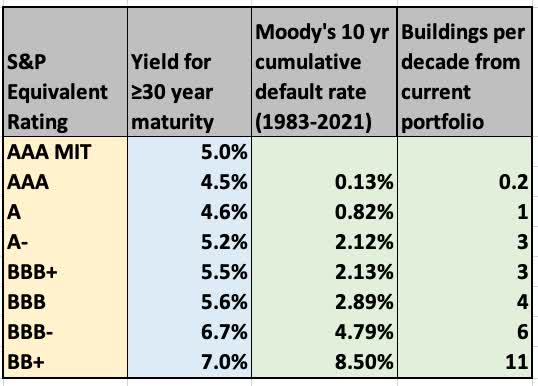
[Notes: The first row shows the 2116 MIT AAA bond. Otherwise, I sourced the data using the Fidelity list of bonds and Moody’s 1983-2021 default rates for equivalent ratings.
The 1920-2021 rates are only available for the full tier without the “plus” or “minus”, and these variations matter significantly. The AAA tier defaulted much more often from 1920 to 1983 than it has since. There is less relative disparity for the other ratings.]
The way I look at this is that with 10% of CRE loans in default during the Great Recession, the fraction of CRE loans for which there would be a ground-lease default might be something like 1% or 3%. (This is also roughly consistent with the results from U.S. structured finance summarized above.) So Safehold might lose 1 to 4 leases from such a period.
Such periods do not occur once a decade, though, it is more like once every 20 years. And there have been only two periods since 1900 that were broad enough by geography and sector that they might produce comparable levels of distress across the entire Safehold portfolio.
So perhaps Green Street will be right and it will be 1 per decade, or perhaps it will be 2 per decade. Or maybe you think it will be more. We will look at the implications for the full range shown in the previous table.
Rents vs. Defaults Over Time
We know that the portfolio of existing ground leases is producing just over $200M of rent per year. We know that these escalate at 2% (and we are ignoring CPI-based adjustments, which will be significant over time).
I modeled the future by applying some cumulative default rate once per decade. The perspective is that defaults will occur in clumps during stressful times, with mild distress appearing about once a decade.
Doing this gets one this projection for the rents from the existing portfolio:
RP Drake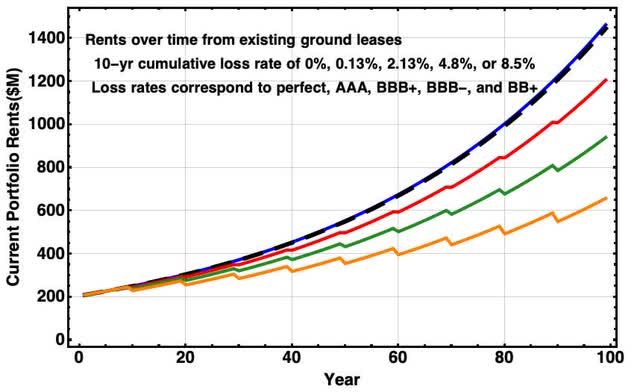
We see that the rents from the current portfolio, absent inflation adjustments, would exceed $1.4B per year by year 99. For BBB+ default rates near 3 defaults per decade, which seems outside of reasonable to me, the rents would exceed $1.2B.
That said, the lower two curves correspond to 6 and 11 defaults per decade. While pinning down a precise number is difficult, it seems clear to me from reading that the default rate across the last century, across the broad real estate sectors and locations representative of the Safehold portfolio, is far below the 5% per decade that corresponds to the green curve.
Costs
Now turn to costs. There are only two significant cost categories for Safehold. These are interest costs and G&A costs.
Take interest costs first. The fixed-rate debt in the current portfolio, at 3.31%, costs about $108M per year. The $500M term loan has a five-year swap to 3%, costing $15M for now, but eventually needing long-term financing.
The remaining $400M (after recent reductions) on the revolver today is at ~6%, costing about $24M. But there are hedges in place that will allow it to be replaced by permanent debt at an effective rate of 3.47%.
My modeling of the floating rate debt effectively assumed a 4% rate for 23 years. After that, all the current debt was taken to be refinanced at 5%. The overall story does not change significantly if one increases that refinancing rate to 7% or somewhat more.
As to G&A, Safehold argues that it does not make sense to count their G&A against current cash flows because its purpose is primarily to support portfolio growth. In effect, they are funding those costs with the debt and equity raised to grow the portfolio. My previous analysis argued that this is sensible.
But still, there are public company costs and the cost of running the portfolio is not zero. This was set at a constant $10M per year. It will increase with inflation but also be spread over a much larger portfolio as near-term growth should approach 25% per year. (If you like another model these calculations are not hard to do.)
Evaluating Funds Available for Distribution, or FAD, as rents less interest costs less $10M, one gets this for future cash flows:
RP Drake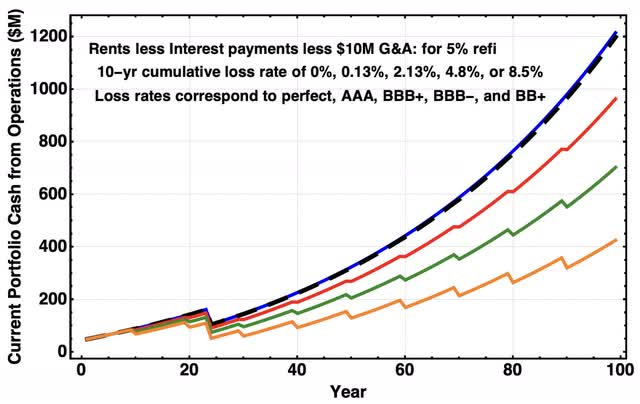
[Some of the Safehold debt is structured with smaller early interest payments and larger ones later. When I model this, the net present value of the cash flows increases for the structured debt. I did not attempt to include that here.]
What This is Worth
What we care about now is not the rents or interest in 2122. It is the Net Present Value or NPV of all the future cash flows. This also can accurately be viewed as the Net Asset Value or NAV of the portfolio.
Here are the NPV results for each of the above curves, as a function of discount rates, with some markers to be explained.
RP Drake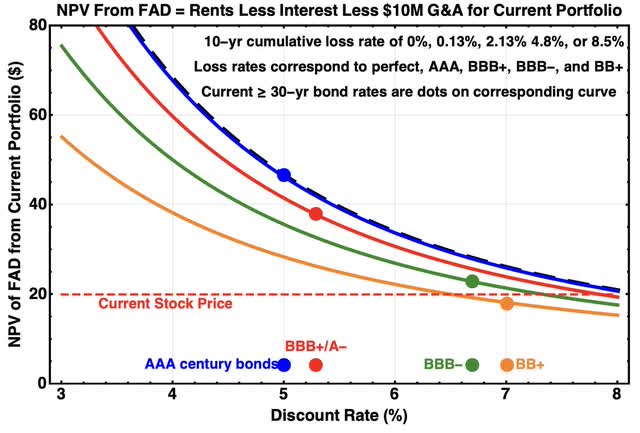
Along the bottom, the dots show the approximate median discount rates (i.e., total return yields) corresponding to the indicated credit ratings. Above each such dot, there is a dot along the curve for that credit rating, representing the NPV today for that credit rating and the corresponding discount rate.
For a default rate corresponding to 1 to 3 leases per decade, the NPV or NAV is in the $40 to $50 range, more than double the current stock price. (Even charging all the G&A against current cash earnings, there is still substantial upside at this level of defaults.) In contrast, if the default rate will be near 10 leases per decade, the current price would be near NAV.
When we move from comparing NAV to seeking fair value, we ask whether there are other factors in the business that demand a discounted or increased stock price relative to NAV. We can look at the positives and negatives here.
Positives: We would increase the fair value above this NAV for these reasons: 1. We expect inflation to increase prices at an annual rate above 2% so that the CPI lookbacks would increase the rents. 2. We expect the company to grow accretively. 3. We see sources of value (i.e. Caret units) beyond what we have analyzed.
Negatives: We would decrease the fair value below NAV for these reasons:
1. We expect earnings and thus NAV to decrease. 2. We see other sources of risk to their model. 3. We distrust management so much that we think them likely to destroy shareholder value even without knowing how.
For my part, I do see all those positives as significant. But NAV for the existing portfolio is so far above the stock price that they do not seem worth the words for now.
Other than defaults, covered above, I’d like to hear specifics from readers concerned about negatives number 1 and 2. Note that leverage is discussed next.
As to negative number 3, it is clear from comments that some investors definitely are in this camp. We can leave it to them to protest in the comments if they wish.
Leverage
In my discussions with Julian, he also expressed concern about the large leverage Safehold has. One aspect of leverage is loan to value, discussed above. But I believe his main concern was primarily focused on ratios like Debt/EBITDA.
Why do we care about Debt/EBITDA? Because it indicates how readily debt can be reduced. The more variable EBITDA is, the more risky Debt becomes.
This is part of why commodity-producing companies seek Debt/EBITDA near 1 and why their market values suffer as they grow. EBITDA is quite uncertain for them.
Reasonable Debt/EBITDA levels are larger for companies that hold hard assets, whose revenues are much steadier. Authors unfamiliar with REITs or midstreams are often horrified by their Debt/EBITDA levels near 5.
For normal equity REITs, EBITDA can be impacted during difficult times. Examples: NNN REIT (NNN) saw EBITDA drop a total of 5% across the Great Recession and 2% in 2020. AvalonBay (AVB) saw a drop of 2% in the Great Recession and 7% across the pandemic.
For Safehold for 2024, EBITDA proper will be in the $200M ballpark with debt about $4000M. So Debt/EBITDA is around 20, which would be extremely high for an equity REIT.
There are two reasons this is not tremendously risky. The first is that the Safehold revenues are far more secure than those of ordinary equity REITs. The second is that over decades, even in cases of very large default rates, those revenues will far exceed the interest payments.
Suppose default rates were at the BBB- level, which seems far too large to me, and that one refinanced all the debt in a year when interest rates were 7.5%. Then one would have three years when interest rates were up to a few percent above rents. But the debt maturities are in reality quite spread out over time and interest rates are very unlikely to be at or above 7.5% more than briefly.
In short, the steady, very secure, growing revenues combined with fixed interest rates of very long and spread-out maturities is why the level of Debt/EBITDA Safehold has does not concern me. You have to decide whether it concerns you.
Multiples
One can view security values generally through the lens of multiples on cash flows. Equity REITs, for example, are often priced near 20x FFO, where FFO is Funds From Operations.
Let’s start by looking at the coupon multiples (i.e. NPV / initial coupon) for the 99-year securities we discussed at the start of the article. The first had a fixed coupon and the second had one that escalated at 2% per year.
RP Drake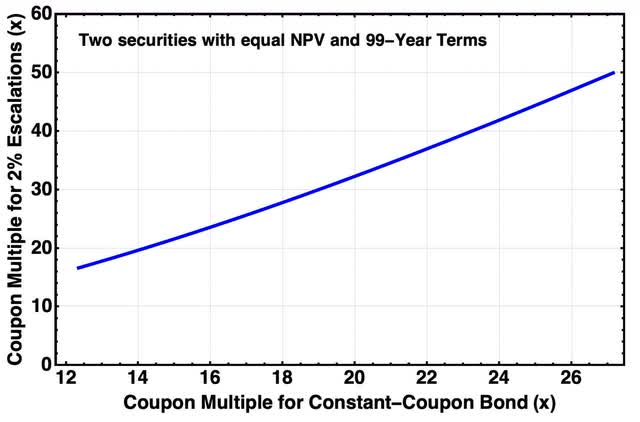
Suppose the constant-coupon security paid 5% of face value, giving it a multiple of 20x. The escalating coupon one would have a multiple of about 32x.
The point is that all securities should not have the same multiple. That would make no sense.
Even so, it is common for authors to use standard multiples. Trapping Value, or TV, used this approach for SAFE here, stating “The first base case here is that SAFE will trade at 20X FFO at some point.”
We can use the framework for finding NPV above to look at earnings multiples for various discount rates. Here is a table of the ratio of NPV to 2024 FAD using the designated discount rates.
RP Drake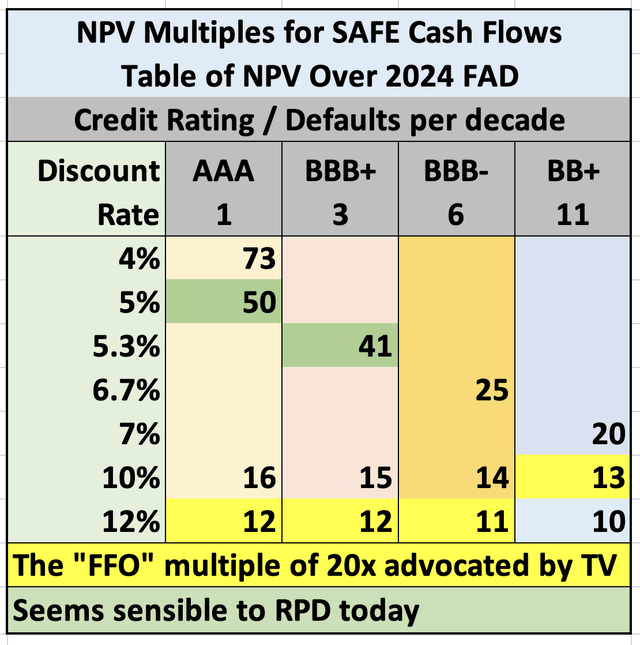
The columns with grey headers in the table correspond to curves in the figure showing NPV above. These are labeled by the credit rating and the number of defaults per decade.
The NPV multiples corresponding to the dots on the NPV curves above form the diagonal entries here. They decrease from the ballpark of 45x for the cases that make sense to me to 20x or a bit more for the very high default rates.
FFO does not make much sense to me for this RINO, and Safehold does not report it. But if we find the FFO by the standard calculation, subtracting all the G&A, then for 2024 it will be about 60% of the FAD found above.
To get the FFO multiple down to the 20x level recommended by TV, the NPV multiple has to go to 12x and the discount rate has to go to 12% for most default rates. Such cases are shaded yellow in the table. Very few bonds are seen by the market as risky enough to demand a 12% discount rate.
This leads to a specific question for the skeptics who view “20x FFO” as a reasonable valuation: Why do you think the future cash flows are so uncertain here that they must be discounted at a rate above 10%?
Takeaways
Reviewing the above, it seems to me that there are two key elements. First, the current Safehold portfolio will produce large cash flows even against the assumption of substantial default rates.
Second, it makes sense to value these cash flows like long bonds rather than like equity REITs. A key difference is that equity REIT portfolios are exposed to 100% of losses in property value while the Safehold portfolio is far less exposed.
At the moment, SAFE is mainly an intermediate-term (or longer) upside play on two theses. One thesis, which in my view will play out soon, is the coming drop in interest and discount rates.
The second thesis, whose timing is not predictable, will play out when the market comes to understand and reflect more of the value here. I have to wonder whether it would be more effective for Safehold to organize itself as a vehicle holding their bond-like ground leases, rather than as a REIT.
Many retail REIT investors will find SAFE of no interest, as they seek current dividends from their investments. But there actually is a market for long bonds.
Investors in long bonds should find SAFE highly appealing, both because of the escalating income and because of the potential for growth with minimal downside risk. Plus some investors subject to high taxes could buy SAFE as a source of long-term capital gains producing low taxable income.
I would also like to thank Safehold management, who have been not just unusually but remarkably willing to discuss details. They likely would argue, with justification, that the presentation here produces results that are far too negative. One aspect is that the CPI-lookback adjustments, ignored here, are likely to be significant.
The bottom line is this. Unless one assumes default rates and discount rates that seem far out of line to me, and despite the conservative assumptions used here, the stock is now priced far below fair value for current discount rates.
Of course, if interest rates and thus discount rates rise further from here, the fair value of SAFE will drop. And since Mr. Market is in a funk about this stock, its price likely will too. As always for SAFE or for any long bond, rising rates are a threat to market valuations.
Read the full article here


