Introduction
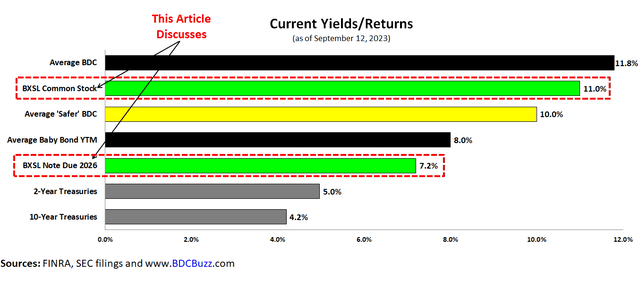
Over the coming months, I will have a series of articles discussing how to build a balanced retirement portfolio using Business Development Companies (“BDCs”) common stocks currently yielding almost 12% and their safer notes – baby bonds/preferred shares with yield-to-maturities ranging from 6.5% to 9.0%.
This article discusses Blackstone Secured Lending (NYSE:BXSL) currently yielding 11% and its 2026 bond/note with a yield-to-maturity of over 7%. BXSL is for lower-risk investors with an investor-friendly fee structure and 98% of its portfolio of first-lien positions in larger companies (relative to smaller BDCs) that would likely outperform in an extended recession environment. Also, BXSL has a relatively stable NAV with lower amounts of non-accrual investments and an excellent balance sheet of lower-cost flexible borrowings that are 64% unsecured.
FINRA, SEC Filings, and BDC Buzz
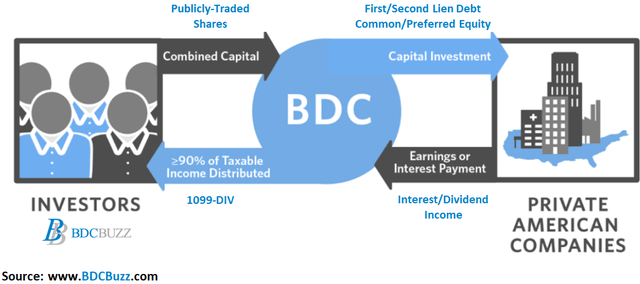
Business development companies invest shareholder capital in privately-owned, small- and medium-sized U.S. companies generating income from secured loans and capital gains from equity positions, much like venture capital or private equity funds.
BDC Buzz
Many readers ask where BDC stocks and bonds fit into their overall portfolio. Your portfolio allocations depend on a few factors, including your age, overall risk appetite, investment time frame, and need to access capital.
Historically, investment advisors used the “100 minus your age” axiom to estimate the stock portion of your portfolio. However, that was likely when the average life expectancy was 65 to 70 compared to the current 85 or higher depending on many factors, and has been revised to 120.
- For example, if you’re 60, 60% of your portfolio should be in stocks.
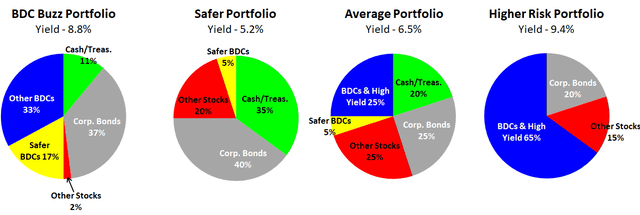
Clearly, BDCs are for longer-term investors so please allow an investment time frame of at least three years. The following charts use the oversimplified asset classes of cash, treasuries, corporate bonds/notes, other stocks (general market equities), and higher-yield investments (including BDCs) along with some examples of allocations and my personal portfolio (not exact):
BDC Buzz

BXSL
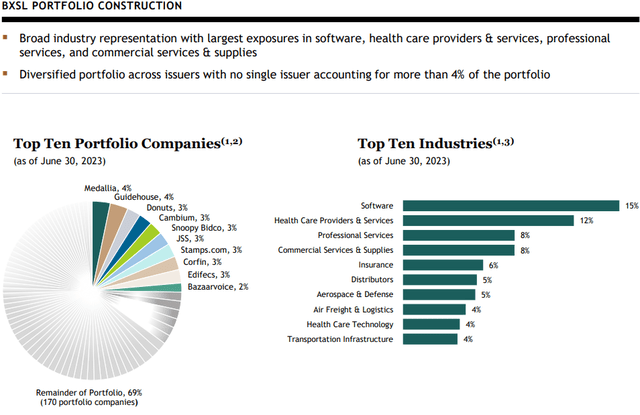
Most BDCs typically do not directly invest in travel, entertainment, retail, restaurants, sporting event-related businesses, airlines, oil/energy, etc., and if they do it’s a small portion of the portfolio. BXSL has 180 portfolio companies across many industry segments including software, healthcare, professional and commercial services, and insurance, which are mostly first lien:
BXSL
We remain steadfast in our approach to invest in larger companies based on the simple belief that larger scale businesses handle the adversity of economic cycles better than smaller ones. The relative risk-adjusted returns of spread per turn of leverage for large deals as well as middle market deals as measured by the Lincoln Senior Debt Index is effectively the same at 158 basis points. But notice some key differences. Larger companies with over $100 million of EBITDA have grown at over 5x the rate of smaller companies with less than $50 million in EBITDA. Larger companies also default much less often with a default rate that is less than 1/5 that of middle market companies, which is why we remain steadfast in our belief that larger scale businesses handle the adversity of economic cycles better.”
BXSL
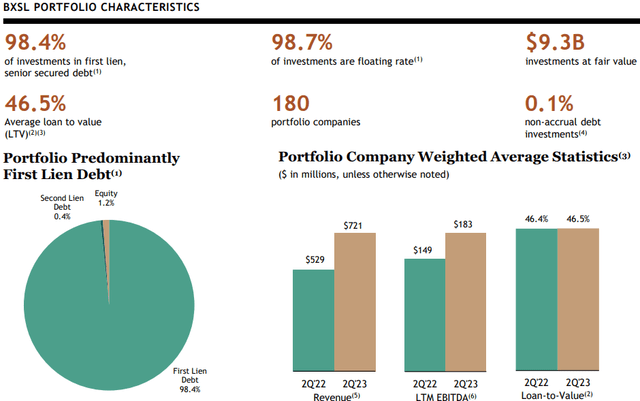
As of June 30, 2023, non-accruals accounted for only 0.1% of the portfolio fair value which is its watch list investment in Benefytt Technologies. Ares Capital (ARCC) also has a position in Benefytt that was added to non-accrual during Q1 2023. As mentioned in the previous articles, Benefytt filed for bankruptcy after paying fraud settlements related to misleading consumers into buying “sham” health insurance plans. Benefytt’s liabilities are as much as $1 billion, while its assets are as much as $10 billion.
Only 0.14% of amortized cost was $0.07 of fair market value of the portfolio is on nonaccrual. Just 1% of our debt investments are currently marked below 90%. We continued our focus on protecting investors’ capital. During the quarter, 100% of the investments we made were first lien senior secured with an average loan-to-value of 43.8%. As of June 30, BXSL’s portfolio is 98% first lien senior secured with a 46.5% average loan-to-value, has a minimal nonaccrual rate of 0.14% at amortized cost or 0.07% at fair market value and has only 1% of debt investments marked at fair value below 90%. More importantly, we’re focused on senior loans with companies of the right size, in the right industries. Focusing on size, our portfolio companies have a weighted average EBITDA of $183 million, relative to $149 million as of 2Q ’22, as we continue to orient the portfolio to larger, more durable businesses.”
BXSL management mentioned low amounts of amendment activity that were mostly related to technical adjustments:
“We saw only two amendments related to performance, which represent 0.22% of our portfolio at cost or 0.21% of fair market value. And we believe those 2 amendment discussions were constructive and will ultimately support a full recovery on our invested capital.”
BXSL Fee Agreement
The Adviser and the company previously entered into an advisory agreement to include a three-year total return lookback feature on the income-based incentive fee, which provides that following the IPO, the incentive fee on income will be subject to a 12-quarter lookback quarterly hurdle rate of 1.50% as opposed to a single quarter measurement and will become subject to an incentive fee cap based on the company’s net cumulative return.
We added an incentive fee look back. This is a three-year total return look back feature on our income-based incentive fee, which may reduce the income-based incentive fee if our portfolio experiences aggregate write-downs, or net capital losses during the applicable trailing 12 quarters.”
The adviser is waiving a portion of the management and incentive fees for the first two years following the IPO. The management fee will remain at 0.75% and incentive fees will remain at 15%, then step up to 1.00% and 17.5%, respectively:
We told investors that we would lead the market with best practices, including lowering our fees so we could bring a more defense portfolio that would protect capital in more challenging market conditions, yet still deliver attractive returns. That philosophy continues to serve us well. We operate at a cost structure about 30% lower than that of our listed peers. We amortize OID over the life of the loan, and we don’t scrape upfront fees for fund assets to the manager because that’s something that we believe runs contrary to true investor alignment.”

BXSL
Interest Expense and Asset Coverage Ratios
The “Interest Expense Coverage” ratio is used to see how well a company can pay the interest on outstanding debt. Also called the times-interest-earned ratio, this ratio is used by creditors and prospective lenders to assess the risk of lending capital to a firm. A higher coverage ratio is better, although the ideal ratio may vary by industry. When a company’s interest coverage ratio is only 1.5 times or lower, its ability to meet interest expenses may be questionable. Please see the following link from Investopedia for more, including how it is calculated:
- Interest Expense Coverage
The “Asset Coverage Ratio” is a financial metric that measures how well a company can repay its debts by selling or liquidating its assets. The higher the asset coverage ratio, the more times a company can cover its debt. Therefore, a company with a high asset coverage ratio is considered less risky than a company with a low asset coverage ratio. BDCs are required to maintain minimum asset coverage of 150% providing strong protection to bondholders, which is one of the reasons that no publicly traded BDC has ever filed for bankruptcy nor defaulted on bondholders in the history of the sector. Please see the following link from Investopedia for more, including how it is calculated:
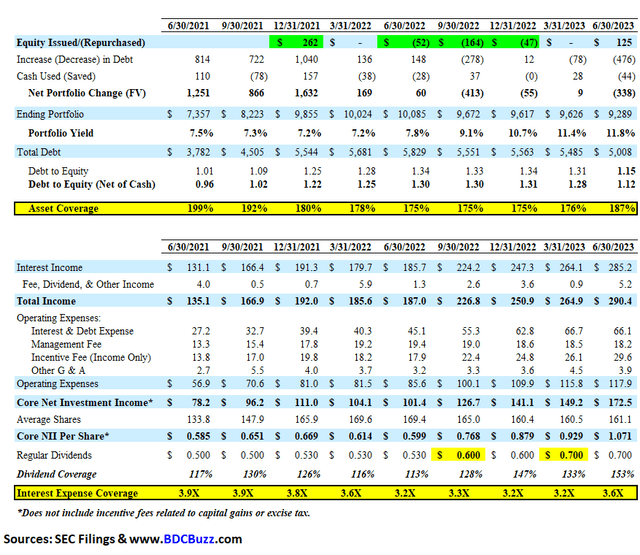
The following table shows the historical coverage ratios for BXSL:
SEC Filings and BDC Buzz
BXSL
However, on August 14, 2023, BXSL issued 6.5 million shares (plus underwriters’ option for another 975,000 shares) for total net proceeds of around $200 million which has been taken into account with the updated projections. Please note that this offering will not have a material impact on NAV per share (slightly accretive) and will increase the share amount by around 4.5% which I have taken into account with the updated projections.
BXSL Investment-Grade Bond/Note
I like BDC bonds partially due to their quality and relatively shorter-term maturities, providing reduced price volatility during market drawdowns, and outperforming other higher-yield assets during market sell-offs. Most BDC bonds mature over the next three to five years which is excellent for investors given the current inverted yield curve (short-term rates higher than longer term).
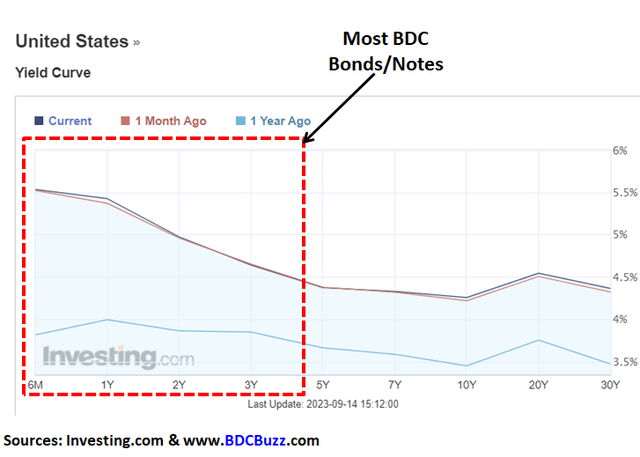
Investing.com and BDC Buzz
I prefer the bonds/notes (with CUSIPS) to the Baby Bonds (with tickers), mostly related to the “make-whole premiums,” which compensate bondholders for the interest they would have earned if their bonds had not been called, or redeemed, by the issuer before the maturity date to ensure that bondholders are receiving fair compensation for the loss of the bond’s future coupon payments. BDC bonds are attractive for many reasons including having higher yields/returns than other investment-grade bonds combined with the capital protections provided by the unique structure of BDCs. Also, given my focus on the risk and quality of BDC common shares, I have an intimate understanding of the risk and quality for bondholders. The following are some options that management teams have before potentially defaulting on a debt obligation:
- Reducing leverage by not reinvesting repayments from portfolio companies
- Reducing the dividend to common shareholders
- Reducing or waiving management and incentive fees
- BDCs have permanent equity capital (no “runs on the bank” to force the liquidation of undervalued assets)
- Raising equity capital: common or preferred, even dilutive if absolutely necessary
- External manager/credit platform can provide additional capital if needed
For these reasons, no BDC has defaulted on a debt obligation.
Changes in BDC bond prices are driven mostly by changes in interest rates and credit spreads (taking into account maturity dates). Most bonds are priced relative to a benchmark which is typically U.S. Treasury rates. A bond’s yield relative to the yield of its benchmark is called a “spread.” The spread is used both as a pricing mechanism and as a relative value comparison between bonds. If a bond with the same credit rating, outlook, and duration was trading at a higher spread, it’s considered to be better priced than the others.
As shown below, the yield-to-maturity (“YTM”) for BXSL’s bond has recently increased to over 7.0%:
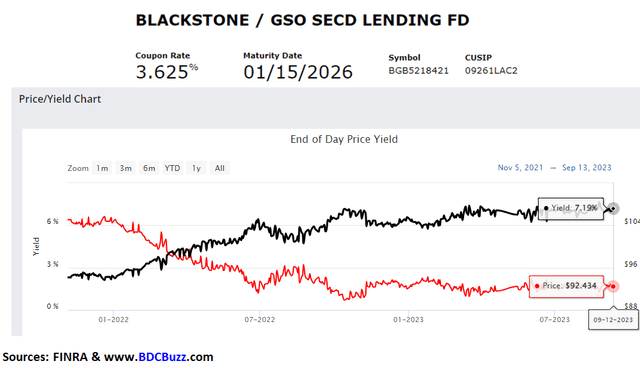
FINRA and BDC Buzz
It’s important to note that you need to set limit orders when buying and selling BDC bonds as the prices can fluctuate quite a bit during a trading day. For example, on Aug. 31, 2023, BXSL’s bond due January 2026 traded as low as $91.60 driving a YTM of almost 7.6% compared to the current treasury yields between (4.5% to 4.8% for two to three years) for a spread of around 2.9% which is slightly higher than the average spread. However, by the end of the day, the final trade was $92.685 with a YTM of 7.0% which is a spread of only 2.3%, and much closer to the other BDC bonds.
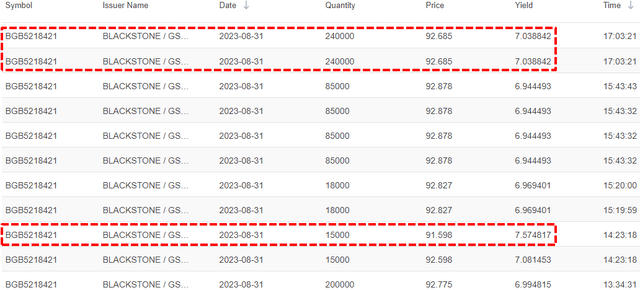
FINRA and BDC Buzz
BXSL Important Considerations
The following are many of the positive considerations for BXSL:
- Recent realized gains from its equity position in Westland Insurance Group
- Its watchlist investment in WHCG (Axia Women’s Health)was marked up
- Solid portfolio of higher credit quality likely among the strongest in the sector
- Investment grade ratings by S&P (BBB-), Moody’s (Baa3), Fitch (BBB-/positive)
- First-lien investments account for 98% of the portfolio fair value
- Highly diversified with mostly larger middle market companies that would likely outperform in a higher interest rate and/or an extended recessionary environment
- One small investment on non-accrual, with only a handful marked over 10% below cost
- Continued realized gains of over $62 million or $0.38 per share, over the last four years
- Excellent historical and projected dividend coverage
- Increased its regular quarterly dividend from $0.50 to $0.77 per share (last eight quarters)
- Paid $0.65 per share of special dividends in 2022
- Management has set the current dividend to take into account potentially lower rates
- Lower fee structure
- Three-year “total return” hurdle or “look back” provision when calculating income incentive fees to protect shareholders from capital losses
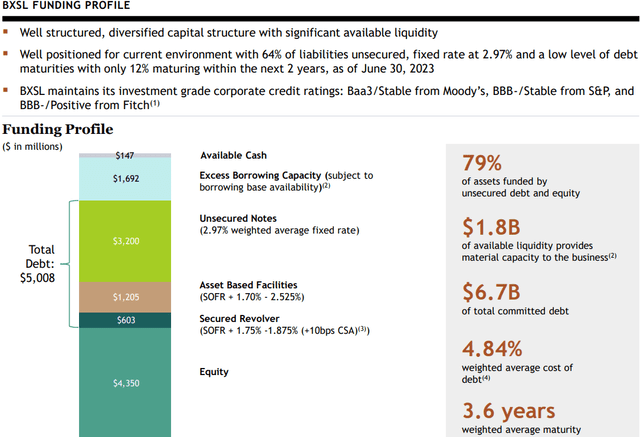
- A solid balance sheet of lower-cost borrowings, currently around 64% unsecured and 79% of assets are funded with unsecured debt and permanent equity capital
- Lower-than-average leverage, especially after the recent equity offering
- Only $400 million of upcoming maturity for its 2023 note (repaid with credit facility), with the remaining $2.8 billion due 2026 through 2028
- Potential repayments driving increased portfolio activity with associated fee and/or prepayment-related income as well as reduced leverage
- Conservative dividend and accounting practices (recognizing fee income over the life of the investment)
- Share repurchase plan was previously renewed for up to $250 million
The following are many of the negative considerations for BXSL:
- Management/incentive fees could increase (if waivers are not extended) on October 28, 2023, but its expense ratio would remain among the lowest in the sector
- Benefytt Technologies was previously amended to include PIK and added to non-accrual status during Q1 2023
- WHCG (Axia Women’s Health) could be added to non-accrual status
- SelectQuote was previously amended to include PIK and remains on watch list
- Lack of clear dividend policy to manage excess earnings and would like to see a quarterly supplemental dividend to reduce the amount of excise tax (drag on earnings)
Upcoming Articles
This article discussed BXSL which is considered a safer BDC with a current yield of 11% for its common stock and 7% for its note due 2026 and both should be considered for a balanced portfolio IMO.
Stock market volatility will likely remain elevated, and BDC bonds allow investors to lock in 6% to 9% annualized returns with maturities ranging from one to eight years. Please note that locking in a much safer return is attractive, especially considering the potential for “reinvestment risk” of investing in treasuries/money market funds (if rates go back down eventually).
As mentioned earlier, I will have a series of articles discussing how to build a balanced retirement portfolio using BDC stocks and their safer bonds/notes. The following table shows some examples of allocations and my personal portfolio (again, not exact) with portfolio yields ranging from 5.2% to 9.4%.
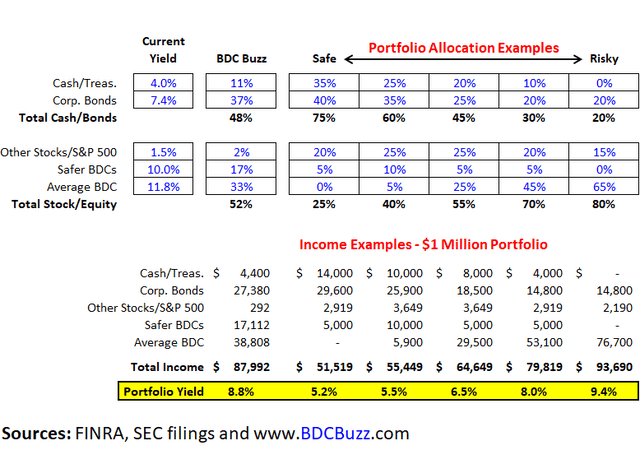
FINRA, SEC Filings and BDC Buzz
Many other BDCs have tradable Notes, Baby Bonds, and Preferreds including ARCC, CCAP, CSWC, FDUS, FSK, GAIN, GBDC, GECC, GLAD, GSBD, HRZN, HTGC, MAIN, NMFC, MFIC, OBDC, OCSL, OFS, OXSQ, PFLT, PNNT, PSEC, RWAY, SAR, SSSS, TCPC, TRIN, TSLX, and WHF. Many of these BDCs have recently issued new bonds/notes providing much higher effective yields earning over 7% to 8% annual cash distributions (paid quarterly) which are much higher than the previous effective yields of 5% to 6%. Each of these bonds has recently been added to the BDC Google Sheets.
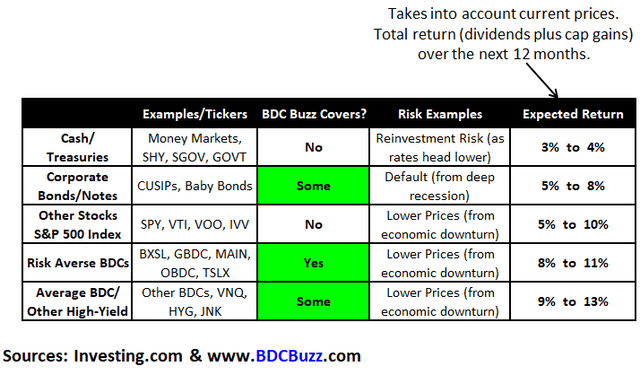
The table below uses what I consider to be conservative estimates for annual total returns (dividends plus capital gains) and takes into account current price levels. The average BDC has provided annualized returns of 32% to 56% for investors who purchased shares near the lows in September 2022 and March 2023 which will be discussed in upcoming articles.
Investing.com and BDC Buzz
Editor’s Note: This article covers one or more microcap stocks. Please be aware of the risks associated with these stocks.
Read the full article here


