The TGT Investment Thesis Remains Decent As A Long-Term Income Play
We previously covered Target (NYSE:TGT) in June 2023, discussing its oversold status then, attributed to the lowered FQ2’23 forward guidance and the $1.1B impact to FY2023’s gross profits from the growing shrinkage problem.
These issues were exacerbated by the excess inventory levels, deteriorating balance sheet, and growing long-term debts, triggering further headwinds in its short-term prospects as the elevated interest rate environment persisted.
For now, TGT has recorded another mixed FQ2’23 quarter, with a revenue miss at $24.77B (-2.1% QoQ/ -4.9% YoY), but an adjusted EPS beat at $1.80 (-12.1% QoQ/ +361.5% YoY), with the sales headwind partly attributed to the pride related boycott.
These have been well-balanced by the inline shrink impact of -0.9 points on its FQ2’23 gross margins of 28.2% (+0.8 points QoQ/ +5.6 YoY), boosted by the end of its price markdowns, as observed by the notable margin improvement on a QoQ and YoY basis.
While TGT’s latest quarter inventory levels remain somewhat elevated at $12.68B (inline QoQ/ -17.2% YoY), compared to the FY2019 levels of $8.99B, we are not overly concerned, since we do not expect another round of inventory clearance moving forward.
The management has already committed to an FY2024 target of 6% in operating margin, with FQ2’23 bringing forth expanded margins of 5% (-0.3 points QoQ/ +3.7 YoY).
In addition, while the excess inventories and the subsequent markdowns have previously triggered the deterioration of TGT’s balance sheet, we believe things may turn around soon.
Thanks to its improved profitability, the management has been able to retire $1.03B of its debts, bringing the sum down to $15.05B (-6.4% QoQ/ +11.8% YoY) by FQ2’23, while growing its cash/short-term investments to $1.61B (+21.9% QoQ/ +40% YoY) and its annualized dividends payout per share to $4.40 (+1.8%).
The same QoQ moderation has also been observed in its annualized net interest expense of $564M (-4% QoQ/ +25.8% YoY). While it may temporarily face higher floating interest rates, we may see the inflation and interest headwinds moderate from these peak levels, with Morningstar already expecting a Fed pivot from February 2024 onwards.
TGT investors need not be overly concerned about its momentarily impacted FCF margins of 1.5% over the LTM (+1.2 points sequentially) since these are mostly attributed to its intensified capex of $5.83B (+23.5% sequentially).
The retailer is more than well-equipped to cover these expenses for now, based on its excellent cash from operations at $7.46B over the LTM (+45.1% sequentially).
These intensified capex may eventually be top and bottom line accretive as well, due to the expanded physical locations/ sortation centers and improved operating efficiencies in its logistics. This is on top of the increased partnership experiences, including Ulta Beauty (ULTA), CVS (CVS), Levi’s (LEVI), Apple (AAPL), Disney (DIS), and Starbucks (SBUX).
Therefore, while its comparable store and digital sales have declined moderately, we believe things may lift moving forward, as TGT expands its same-day deliveries and Drive-Up in-store services to directly compete with Walmart (WMT) and Amazon (AMZN).
The Correction Is Much-Needed, Given The Inflated Hyper-Pandemic Valuations
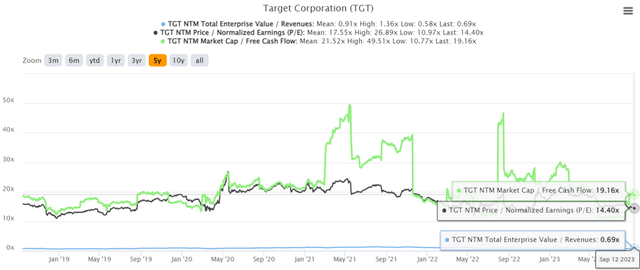
TGT 5Y EV/Revenue, P/E, and Market Cap/ FCF Valuations
S&P Capital IQ
For now, TGT trades at NTM EV/ Revenues of 0.69x, NTM P/E of 14.40x, and NTM Market Cap/ FCF of 19.16x, lower compared to its 1Y mean of 0.79x/ 17.01x/ 20.45x, though nearing its 3Y pre-pandemic mean of 0.69x/ 14.18x / 15.26x, respectively.
This means that the recent correction already has the intended effect of normalizing most of the hyper-pandemic valuations, as seen in the chart above, providing interested investors with improved entry points.
Consensus Forward Estimates
Tikr Terminal
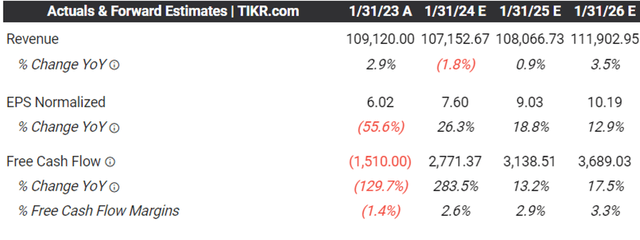
TGT’s forward estimates remain stellar as well since it suggests an excellent growth cadence at normalized top and bottom line CAGRs of +6.2% and +8.1% between FY2019 and FY2025. This is compared to its pre-pandemic levels of +0.9% and +6%, respectively.
The pandemic has been good for the retailer indeed, as seen by the projected improvements in its revenues and adjusted EPS, compared to the pre-pandemic levels of $78.11B (+3.7% YoY) and $6.39 in FY2019 (+18.6% YoY), respectively,
Therefore, while TGT has to temporarily lower its FY2023 adjusted EPS guidance to $7.50 at the midpoint (+24.5% YoY), compared to the previous number of $8.25 (+37% YoY) due to the boycott, we are not overly concerned since these are temporal headwinds.
The management has already reported “meaningful recovery in July 2023,” with the Independence Day Holiday and its member-exclusive sale between July 9 and July 15, 2023, generating over 1.5M in new memberships.
So, Is TGT Stock A Buy, Sell, or Hold?
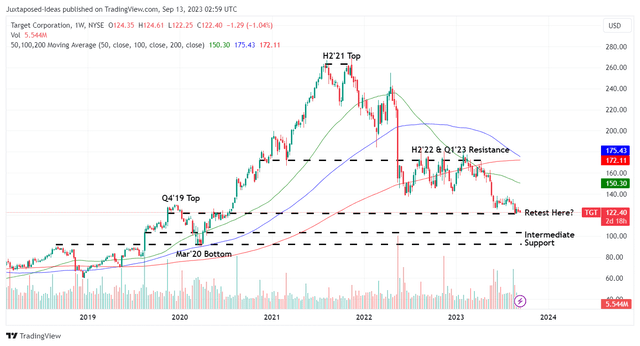
TGT 5Y Stock Price
TradingView
Assuming that the consensus estimates turn out as expected, it is not overly ambitious to project a long-term price target of $146.73, based on its NTM P/E of 14.40x and the FY2025 consensus adjusted EPS estimates of $10.19. Thanks to the recent correction, there is still an excellent upside potential of +19.8% as well.
Therefore, while the TGT stock may have drastically moderated from its previous H2’21 top, we are cautiously confident about the management’s laser focus on top/ bottom line growth, network expansion, value-added services, and optimized operating efficiencies.
With the retailer expected to continuously generate positive Free Cash Flow through FY2025, investors need not fret about the safety of its dividends as well, with the Seeking Alpha Quant currently rating it as a B.
However, TGT investors must also note that this correction may not be over yet. For example, the stock has already recorded lower highs and lower highs since the recent FQ2’23 earnings call, with it currently retesting its critical support levels of $120s.
It appears that market sentiments are turning pessimistic as the federal student loan repayment starts from October 2023 onwards, despite TGT’s improved “traffic and comparable sales in July and August 2023.”
As a result of the potential volatility, investors may want to observe the situation a little longer. Assuming that its critical support is breached, we may see the TGT stock retrace to its next support level of between $102 and $112, implying a downside of -13% at the midpoint.
On the other hand, the lower levels may also unlock an expanded forward dividend yield of 4.15%, compared to its historical yield of 2.03% and sector median of 2.72%.
Therefore, depending on their risk appetites and dollar cost averages, investors may want to time their buys accordingly, since it remains to be seen if the current floor may hold.
Read the full article here


