SolarEdge Technologies, Inc. (NASDAQ:SEDG) delivered a remarkable performance in the second quarter of 2023, demonstrating its strength and adaptability in the industry. The company’s financial accomplishments were notably driven by its solar division, which saw substantial growth year-on-year, signifying SolarEdge’s increasing prominence in the solar sector. This article offers a technical examination of SEDG’s stock price to determine its potential trajectory and investment prospects. The analysis reveals that the stock is currently in an oversold territory, indicating potential for a price rebound. Additionally, the stock price is approaching a robust long-term support zone, suggesting a promising long-term investment window.
A Look into the Second Quarter Achievements of 2023
The company achieved commendable financial milestones in the recently concluded second quarter of 2023. One of the standout figures is the record GAAP revenues, which reached $991.3 million. This represents a sequential growth of 5% compared to the previous quarter and underscores a significant 36% rise from the same quarter of the previous year. Such growth dynamics show steady and robust momentum in the company’s operations.
Delving deeper into specific segments, the solar arm of the business emerges as a significant growth driver. The solar part clocked in record revenues of $947.4 million, marking a 4% quarter-on-quarter increase and a remarkable 38% from the corresponding quarter last year. This significant annual growth underscores the company’s strengthened position and growing presence in the solar market.
From a geographical standpoint, specific markets have showcased standout performances. There were record solar revenues in Germany, the U.K., Switzerland, South Africa, and Thailand. Such achievements signify the company’s solid market penetration and growth strategy in these regions. Furthermore, data reflects a strong presence in Europe, given its continued vigor in its residential and commercial sectors. However, a contrasting picture emerges from the U.S. residential market, showing signs of stagnation. This plateau in the U.S. market might require strategic interventions.
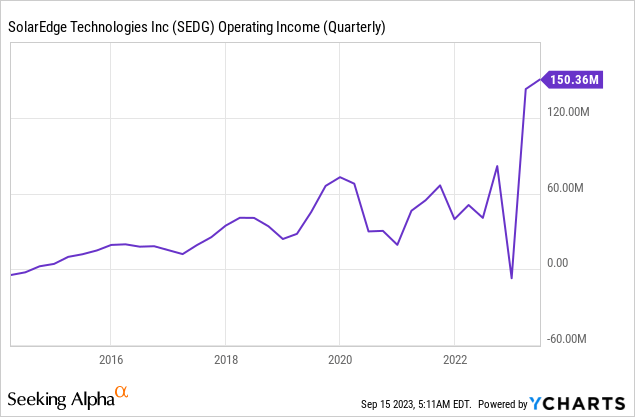
On the operational front, the company’s performance is noteworthy. A healthy gross margin was reported, leading to a record operating income. The operating income for SEDG for the second quarter was $150.35 million which has increased sharply in 2023 as seen in the chart below. This increase in operating income indicates that the company is achieving operational efficiencies, translating to enhanced profitability.
In terms of product shipments, the company made significant strides. Over 4.3 GW of inverters, pivotal in solar installations, were dispatched. A highlight among these was the C&I inverter segment, which saw shipments of 2.6 GW, marking a substantial 25% sequential growth. Additionally, progress is evident on the U.S. manufacturing horizon, with the company gearing up for initial inverter shipments by Q3 2023. Moreover, the residential battery shipments surged to 269 MWh, up from 221 MWh in the preceding quarter. This 21.7% quarter-on-quarter growth suggests a burgeoning demand for residential energy storage solutions.
Additionally, SEDG launched its 330kW Inverter and H1300 Power Optimizer, aiming to serve community solar, agri-PV, and smaller utility P.V. projects. The new products offer centralized and distributed installation options, focusing on enhanced design flexibility, safety, and module-level monitoring through Module Level Power Electronics (MLPE). A key feature is the potential 50% reduction in the Levelized Cost of Energy (LCOE) due to increased inverter efficiency and optimized energy production. With orders open for 2024 U.S. projects and plans for an expanded regional release, SEDG is further solidifying its industry leadership.
For the third quarter of 2023, SolarEdge projects a revenue range of $880 million to $920 million. The anticipated non-GAAP gross margin is set between 28% and 31%. Similarly, the company expects its non-GAAP operating income to fall between $115 million and $135 million. Delving deeper into its core business, the solar segment’s projected revenue is estimated to be in the ballpark of $850 million to $880 million, with a gross margin anticipated to range from 30% to 33%.
Navigating the Nuances of Price Drops and Investor Concerns
The SEDG monthly chart below reveals a significant price consolidation over the past two years. This consolidation shifted downwards, indicating a possible decline in price. Nonetheless, a glance at the long-term trajectory of SEDG displays a bullish trend, especially when considering the robust rally during 2019 and 2020. This surge was the product of several converging factors. Firstly, the company consistently reported strong quarterly financial performances, beating estimates and showcasing robust growth in revenues and profits. The solar industry, as a whole, witnessed an uptick in demand, driven by heightened environmental consciousness, favorable government policies, and declining costs of solar installations. SEDG, as a leading player in the sector, particularly benefited from its innovative MLPE solutions, gaining a competitive edge over its peers. Furthermore, the company’s global expansion and diversification into energy storage and e-mobility solutions signaled strong prospects, further fuelling investor confidence and driving the stock price upward.
SEDG Monthly Chart (stockcharts.com)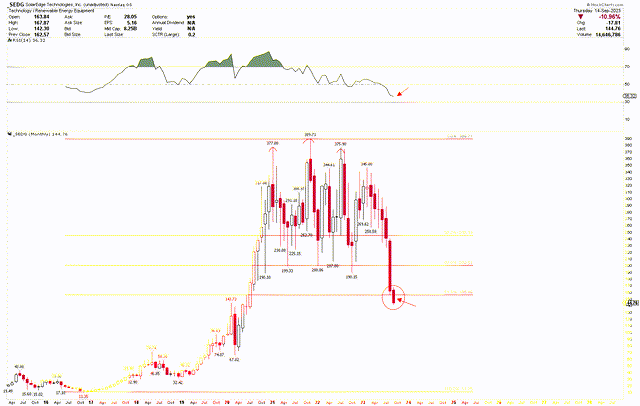
The stock peaked in November 2021 and began to show signs of decline afterward. This has caused the stock price to approach a critical support level, evident from the Fibonacci retracement that stretches from the 2016 low of $11.35 to the 2021 high of $389.71. This price adjustment is nearing the 61.8% Fibonacci retracement support level. Notably, the monthly candlestick pattern suggests a potential breach below this support. However, if the price rebounds above $155.88 to close the month of September 2023, it might indicate a bullish resurgence.
The weekly chart below further illustrates this complex scenario. A triple top at $377, $389.71, and $375.90 hints at a bearish trend, especially since the pattern’s neckline was breached at $190. This results in a short-term declining trend. This descent now tests the upper boundary of the long-term support bracket, which spans from $144 to $67. Given this support bandwidth, a further price decline could be on the horizon. Still, investors might consider this a buying opportunity, especially as the RSI enters the oversold zone and the support begins at this juncture. If there’s a price rebound, the primary target could be the $190 neckline.
SEDG weekly chart (stockcharts.com)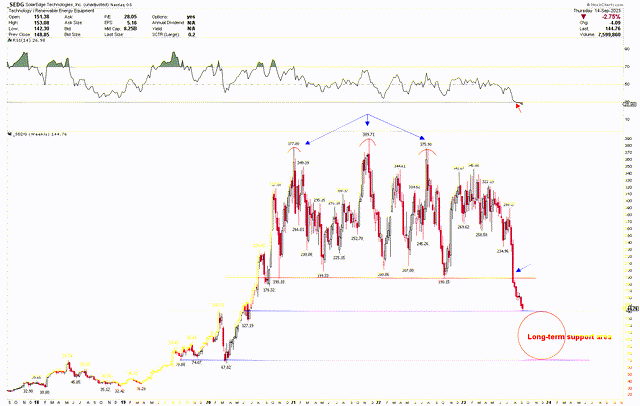
While the short-term outlook is bearish, the long-term perspective remains optimistic. The subsequent daily chart emphasizes that the latest downward thrust commenced once the dominant falling wedge was broken. Such a pattern is typically bullish, but its downward break suggests a potential final dip before a long-term upward rally. Furthermore, a strongly oversold daily RSI implies an impending buying interest.
SEDG Daily Chart (stockcharts.com)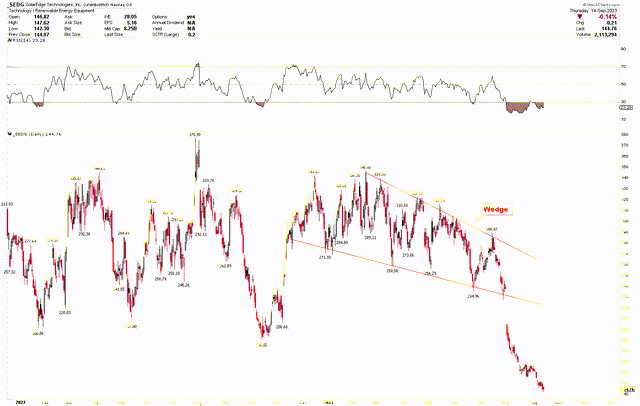
Investors may consider buying SEDG at the present value since it’s venturing into crucial long-term support levels between $144 and $67. Should the stock price continue to fall, augmenting positions within this bracket may be prudent. Nevertheless, if it falls below $67, the long-term bullish narrative could be challenged, indicating prolonged lower prices.
Market Risks
The U.S. residential market’s slowdown poses challenges for SEDG, potentially requiring strategic shifts if this trend persists. Furthermore, while new product launches like the 330kW Inverter and H1300 Power Optimizer target a broader audience, the fast-paced nature of the market brings uncertainties in product adoption rates. The company’s remarkable revenue records in various international markets signify its expanding presence, but they are not without vulnerabilities, given potential geopolitical or policy changes in those regions.
The burgeoning solar industry, though promising, invites fierce competition, and as SEDG ventures into new territories and innovations, maintaining its market share becomes imperative. This industry also relies on supportive government policies, and sudden policy alterations or incentive withdrawals could stunt growth. External economic factors, such as fluctuating interest rates and global economic conditions, can shape the demand for solar products and influence investor outlook on renewables. From the technical perspective, the SEDG stock price is trading in the support range, and any breach of $67 might negate the long-term bullish outlook.
Bottom Line
SEDG has showcased an impressive trajectory in the second quarter of 2023, exhibiting robust financial growth, operational efficiency, and strategic market expansion. Their pivotal achievements, particularly within the solar and energy storage sectors, are emblematic of the company’s industry leadership and innovative prowess. Geographically, while Europe and select markets have proven lucrative, challenges loom in the U.S. residential arena, necessitating strategic recalibrations. The launch of new products underscores SEDG’s commitment to addressing diverse market needs and pushing the frontiers of solar technology. However, as with any industry leader, the company confronts multifaceted risks, spanning market competition, policy dynamics, and global economic uncertainties. The technical analysis for SEDG reveals robust long-term support, suggesting a compelling buying opportunity. Yet, there’s no evident reversal, and the support range is notably wide, spanning between $67 and $144. Investors may consider buying SEDG at current rates and accumulate positions if the stock price declines within this range.
Read the full article here


