Not too hot, not too cold
The movements in employment and wage growth data seem to be coming to the fore in recent weeks. While it is true that things under the hood do not paint an overly favourable outlook for unemployment (as we shall see later), it is important to remember that based on “today’s” data (and I emphasise today for good reason, as we shall see), the jobs market is in a relatively benign position. It is neither as hot as it was throughout 2022 as wage growth surged to decade highs, nor is it yet near recessionary or even contractionary levels. As it stands, policymakers are yet to find reprieve from the labour market in their “data-dependant” stance on monetary policy tightening.
In reviewing the current status of the labour market (remembering, of course, that employment and wages are lagging economic indicators), signs of a tight(ish) jobs market are still present. As of the BLS’ August employment update, the unemployment rate still stands at only 3.8%, just shy of the cyclical low set earlier this year and well below any of the lows seen from the late 1960s to late 2010s.
Acheron Insights, St. Louis Fed, BLS, NBER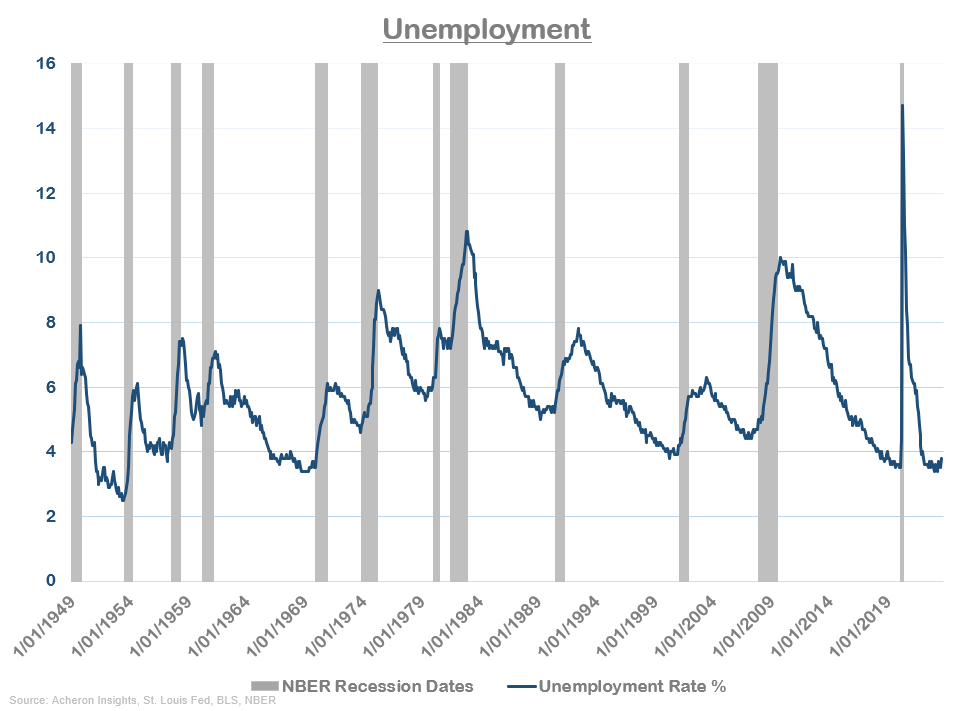
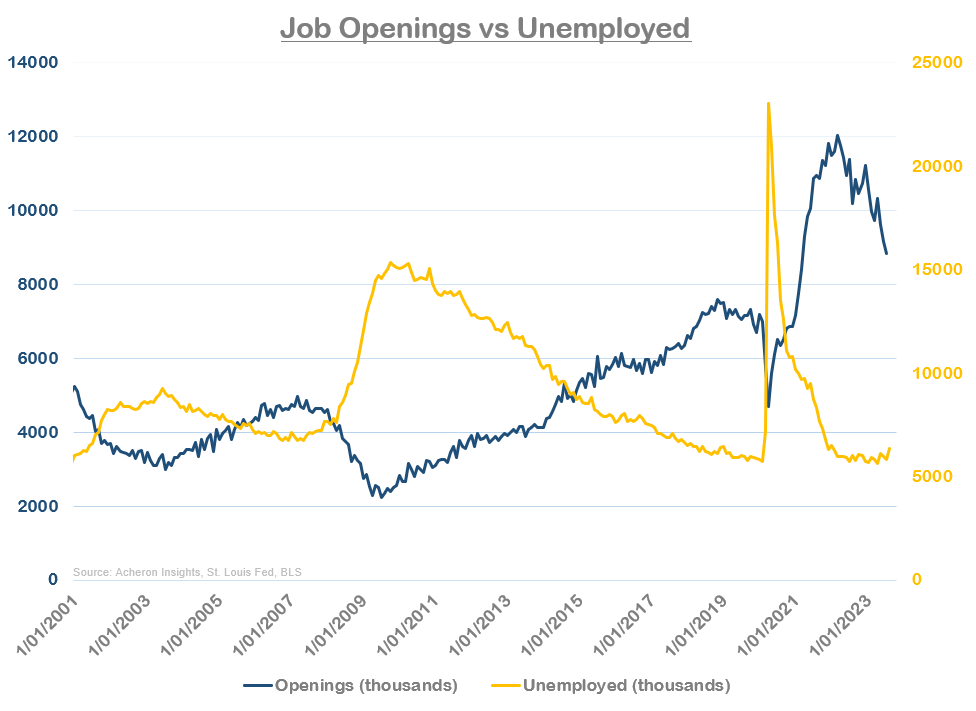
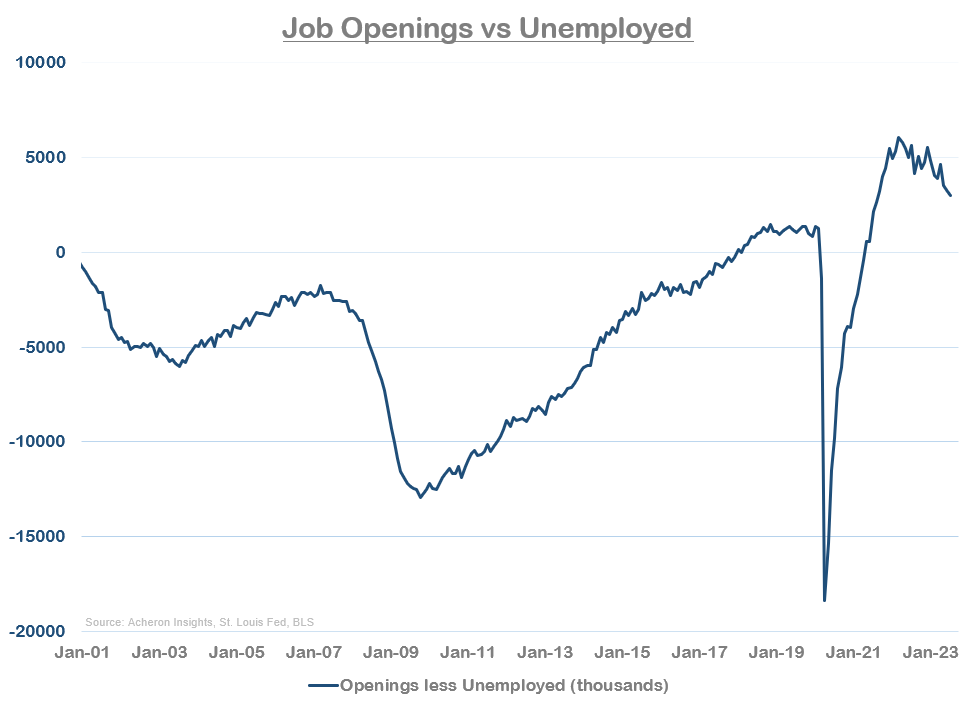
Meanwhile, job openings still vastly exceed the number of unemployed persons (8,827 thousand vs. 6,355 thousand), though the level of job openings has declined materially over the past six months. This equates to a job market still in deficit, but one that is no longer at the historically tight levels that it was and is slowly moving toward equilibrium.
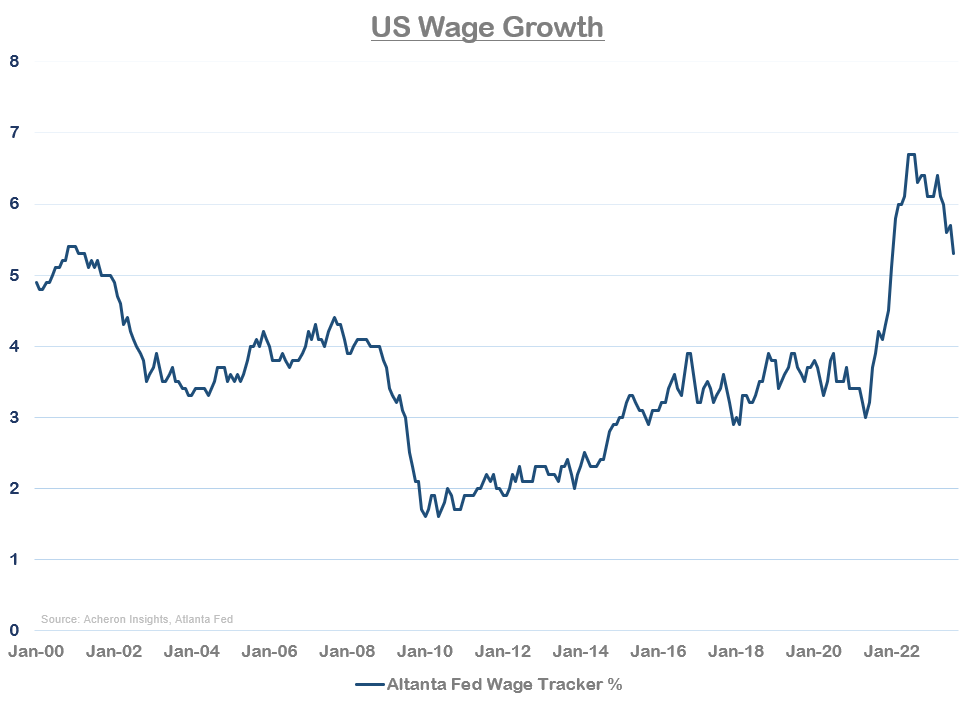
As a result, wage growth has cooled in recent months. And while this trend is good news for inflation and monetary policy, it should be reiterated that wage growth is still higher than any level seen from the early 2000s up until early 2022. Wages are still growing at 5.4% according to the Atlanta Fed.
The same can be said of the growth in unit labour costs. Though slowing, unit labour cost growth is also still higher than any level seen during the 2000-2021 period.
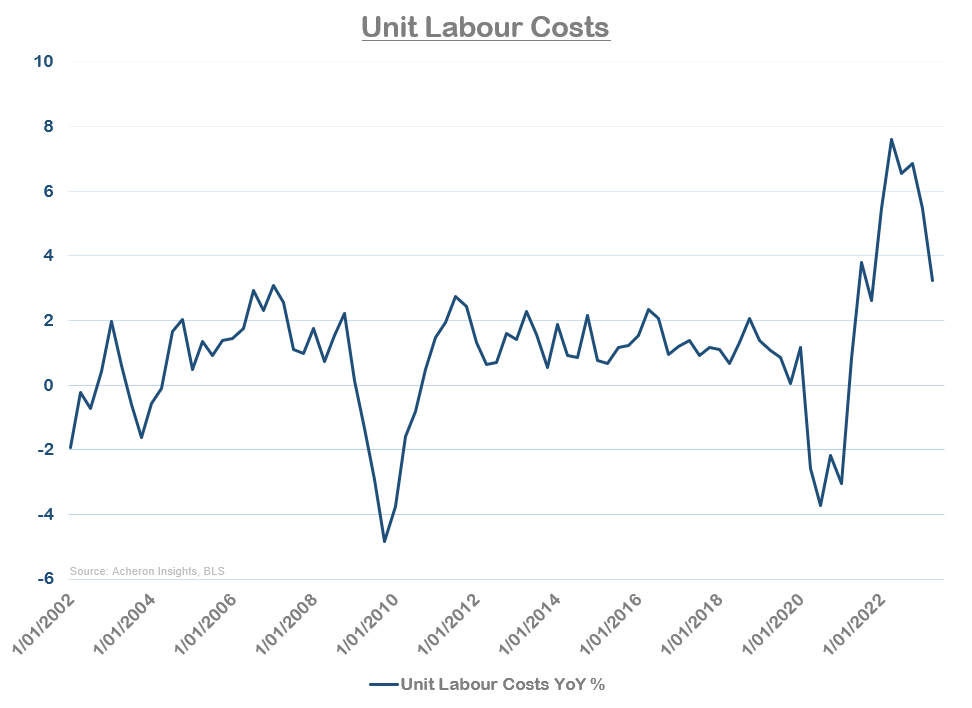
Focusing on unit labour costs is perhaps the best way to gauge the Fed’s reaction function to the jobs market. Unit labour costs, or unit wage costs, are a measure of wage growth in excess of labour productivity. By netting out the effects of productivity growth, unit wage costs capture the actual cost a business pays its workers per unit of output and is a variable on which central bankers put a great deal of emphasis in their forecasts and decision-making.
Not only have we had a situation in which wage growth has been strong, but we have also seen falling productivity over much of the past decade-plus. This does not mean workers are not as efficient or working as hard as they once were, after all, technological progress has provided us with the means of efficiency and information abundance to the largest extent in human history. Rather, the increased costs businesses are incurring for producing products is more a result of the significant increase in areas of risk management, compliance, human resources, ESG, and cybersecurity among others, and the additional burdens these departments are putting on businesses, for good and bad. As such, businesses, particularly banks and financial institutions whose compliance and risk departments are as great as ever and which are some of the largest employers in the world, are simply required to hire more workers to produce the same level of output.
Strong growth in unit wage costs is highly inflationary and central bankers simply will not sway from their path of tight monetary policy until unit wage cost growth fully abates. Fortunately, wage growth and unit wage costs seem to be cooling to some degree, though they do remain much higher than central bankers would like to see.
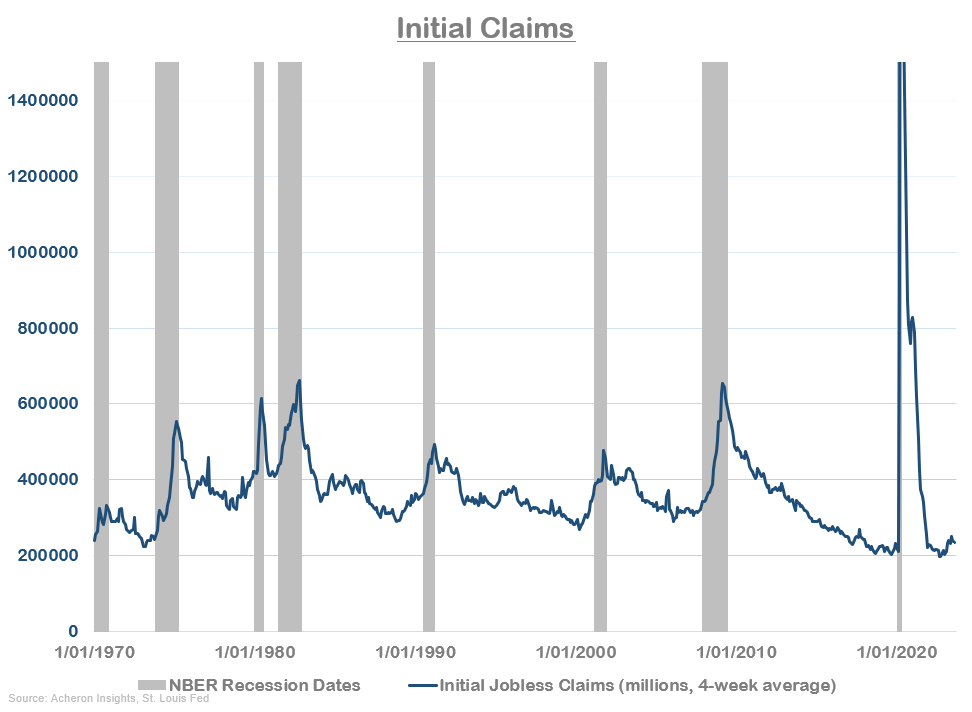
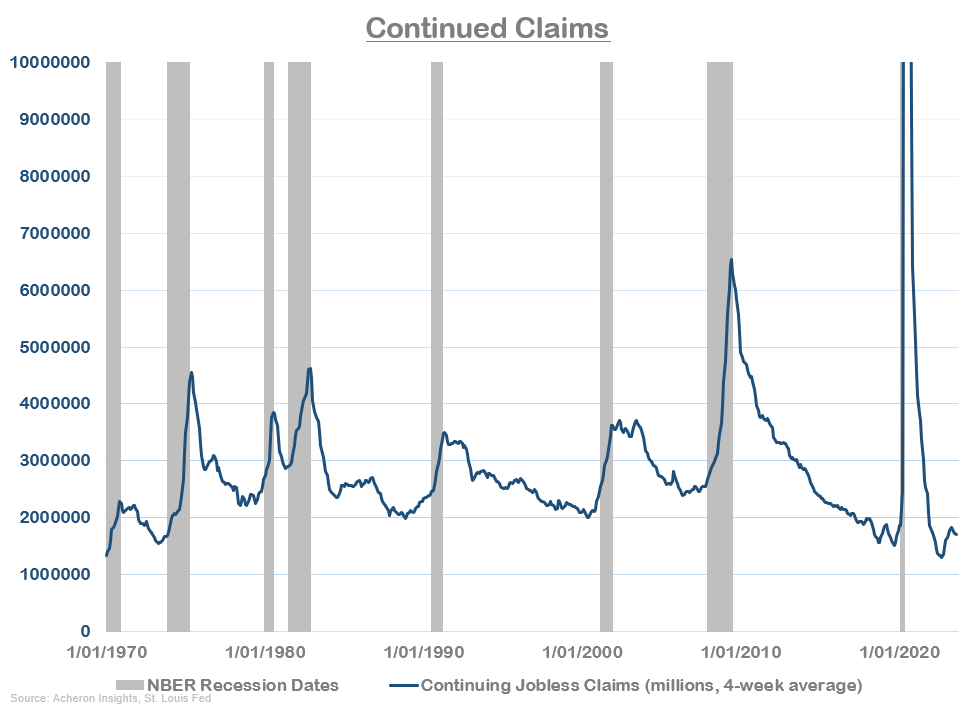
Meanwhile, jobless claims are another indicator signaling a relatively stable job market at present and are not yet confirming any imminent recession. A far more material spike is needed in both claims (and then unemployment) to meet the NBER’s definition of recession. Based on today’s numbers, we are not there yet.
This is true of both initial claims…
As well as continued claims.
However, if we view initial claims through the lens of the percentage of US states with annual changes in claims rising significantly, which has spiked materially per the below, we can see that under the hood there is weakness in the jobs market. This should slowly translate into an outright rise in initial claims in the coming quarters.
Macro Ops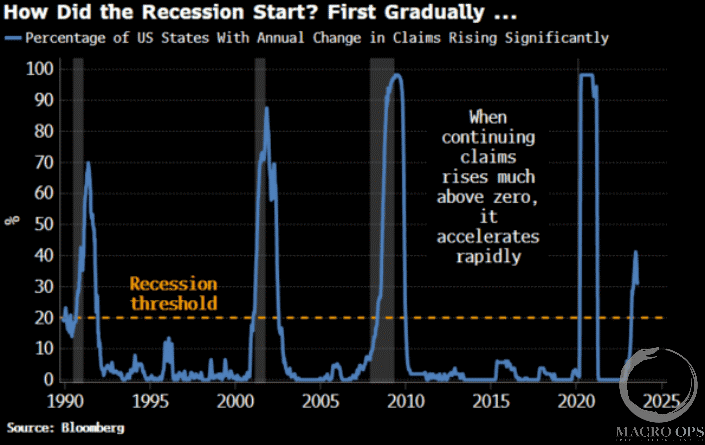
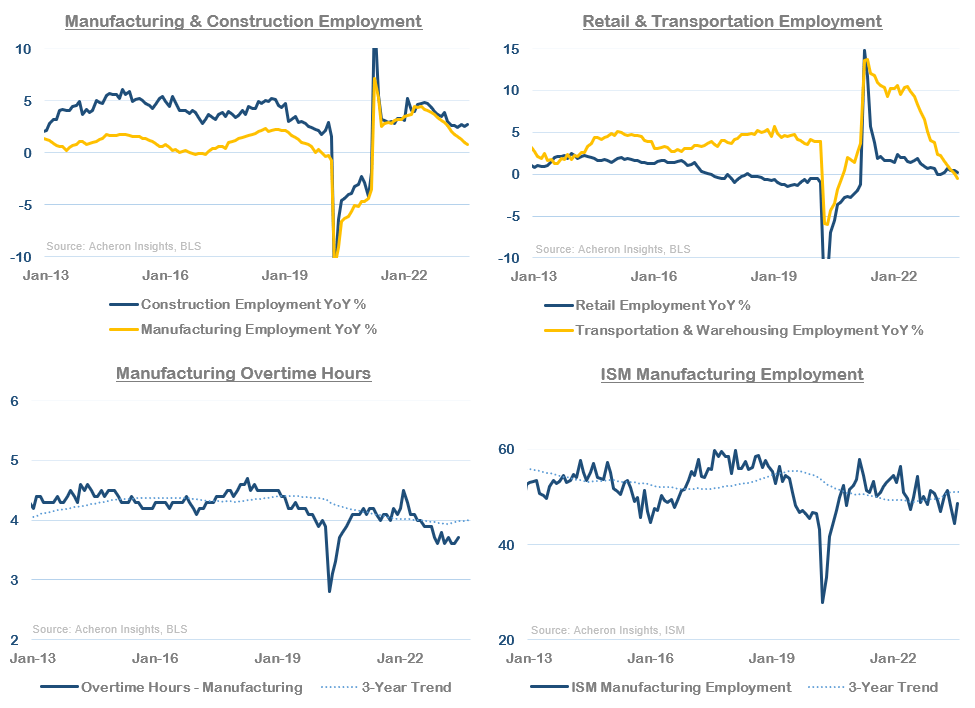
If we turn our attention to the cyclical areas of the job market, primarily that of manufacturing, construction, retail, and transportation, further evidence of this underlying weakness appears evident. While they are still positive, the trend in manufacturing and construction job growth is clearly down, particularly in relation to manufacturing (in line with the notion we are probably already amid a manufacturing recession, highlighted by the fact that manufacturing overtime hours and the ISM manufacturing employment index are both at cyclical lows), while transportation and warehousing employment has also been decelerating markedly of late. Retail job growth also remains weak.
While there is clear weakness in the cyclical areas of the jobs market, we must remember the manufacturing sector accounts for only a small portion of the overall employment picture.
42 Macro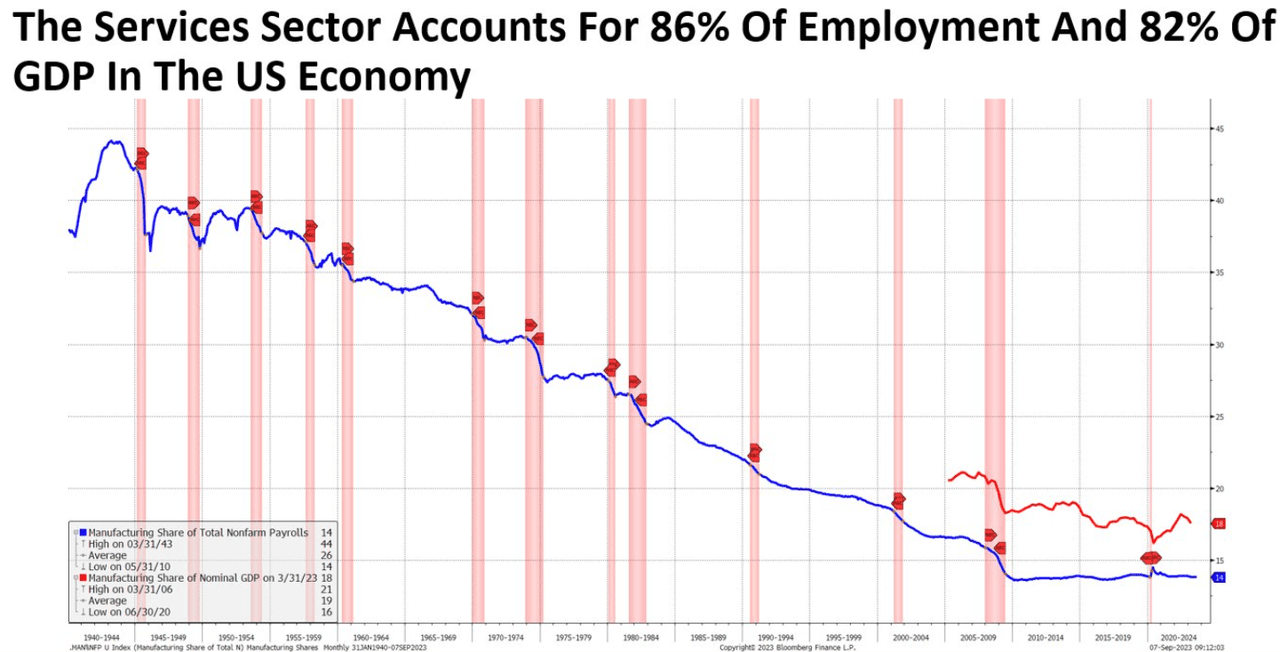
It is true that the sectors above drive much of the cyclicality of the job market and economy overall, for the labour market to truly weaken we need to see weakness in services employment.
In comparing the growth of cyclical and non-cyclical employment, it is clear that much of the job weakness we have seen thus far has from the cyclical areas of the market in manufacturing, construction, retail, and transportation. Non-cyclical employment (i.e. services) growth has been trending lower, but it still remains well above its 2000-2021 average.
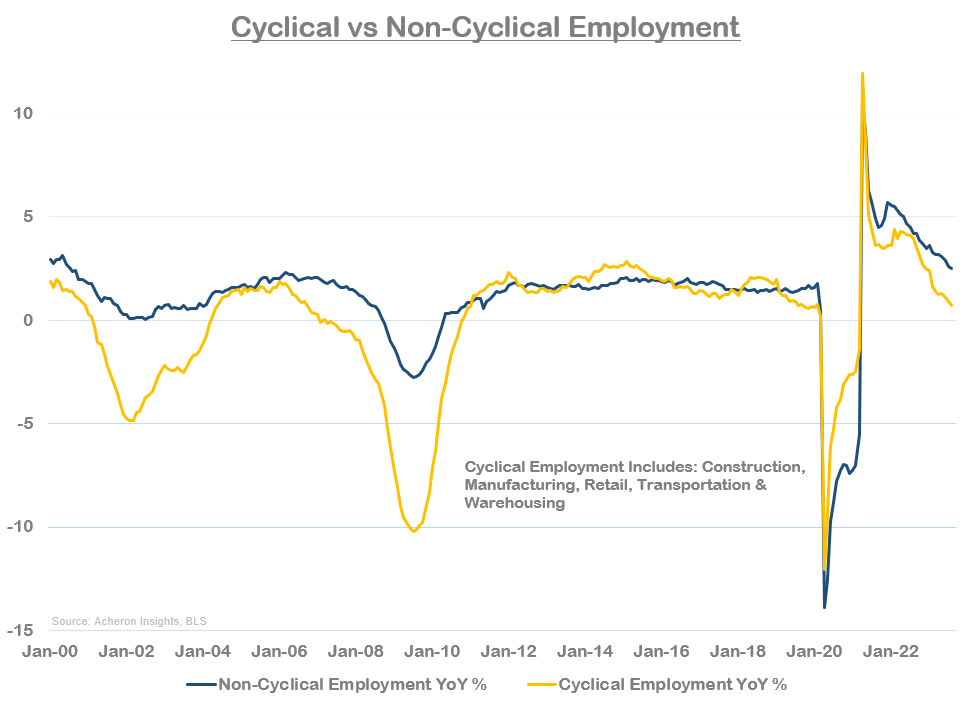
While services employment is still relatively robust, it is trending lower and I see no reason why it won’t follow the trend being set by the cyclical areas of the jobs market.
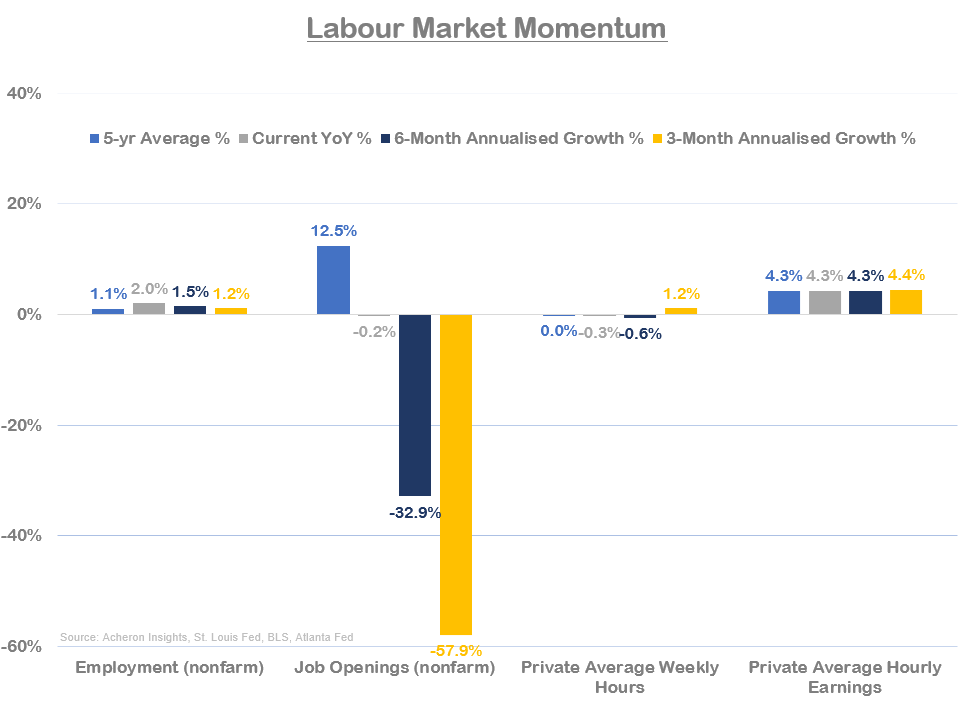
If we delve a little deeper into the momentum of a number of key labour market statistics, we can again see confirming evidence that while the labour market is still robust, there is evidence of downside momentum and underlying weakness. This is most evident in relation to job openings, which are falling at a rapid pace (-58% three-month annualised growth as of July). Overall employment growth is also weakening (albeit to a far lesser extent), while average weekly hours and average weekly earnings remain robust.
Perhaps more important however is the trend in the revisions of non-farm payrolls, which has just been revised lower for the seventh consecutive month. The most striking of which relates to June, having been revised lower by 104,000 from the BLS’ initial release. When it comes to the jobs numbers, past data is not an accurate representation of past data.
Variant Perception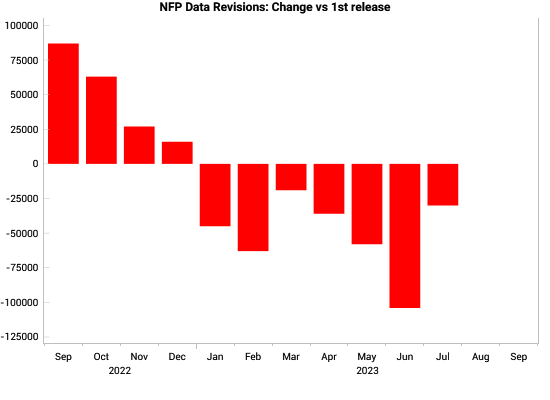
Expect the jobs market to continue to cool
So, we have established the labour market is still relatively strong based on current data release, but it is not at the extreme level of tightness seen 12 months ago, with job growth and wage momentum now firmly toward the downside. The question is, are these downward trends conducive to a material rise in unemployment or will the Fed get its soft landing after all? To this, we must consult the leading indicators of both employment and wages.
Starting with what is perhaps the most important dynamic in driving employment, is the business cycle. Relative to the ISM Manufacturing PMI (my preferred proxy for the business cycle), we can see overall employment growth should continue to trend lower over the next six months, and could well turn negative at some point in early 2024.
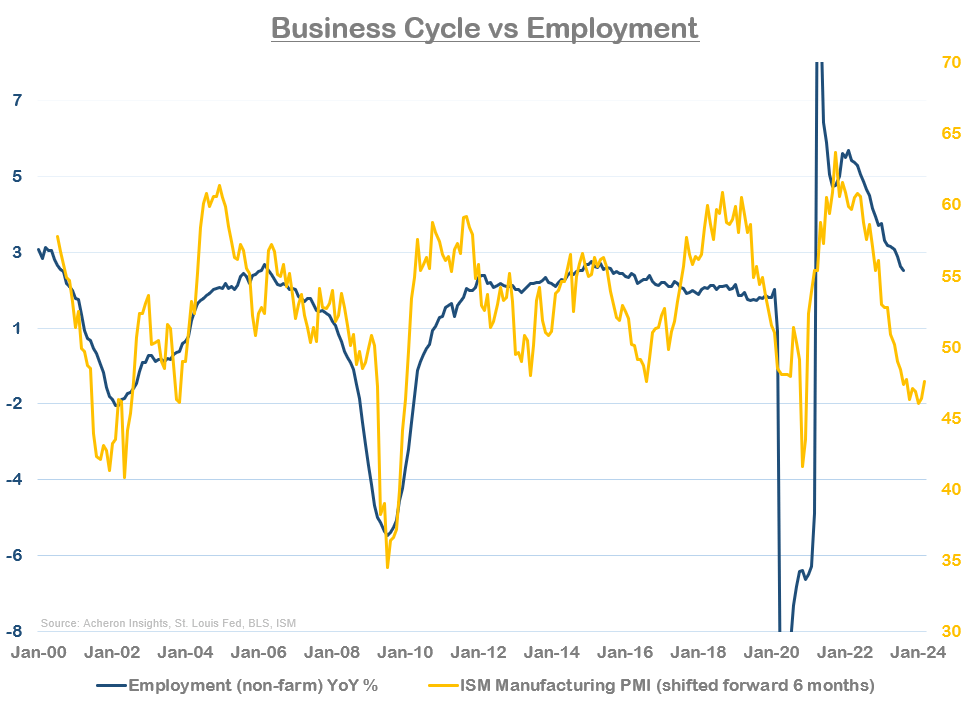
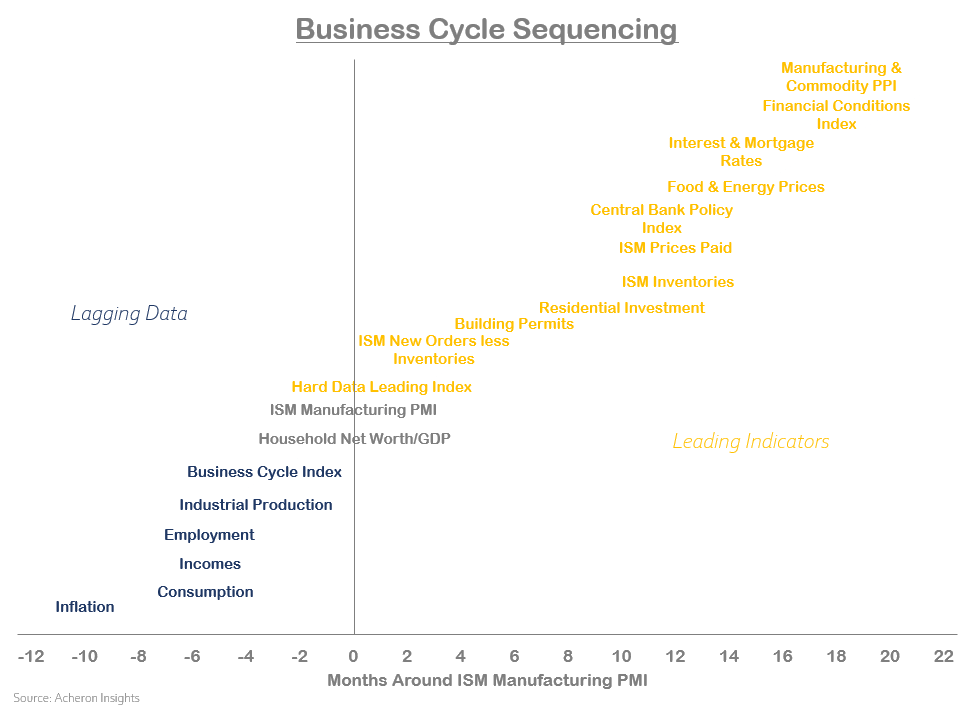
This is where it becomes integral to understand the leads and lags of the business cycle. Employment and wages are two of the most lagging economic indicators, and as such generally lag the growth cycle by around six months or so, as we can see below. Intuitively, this makes sense. Laying off workers is a last resort for employers and generally occurs when economic growth has already bottomed.
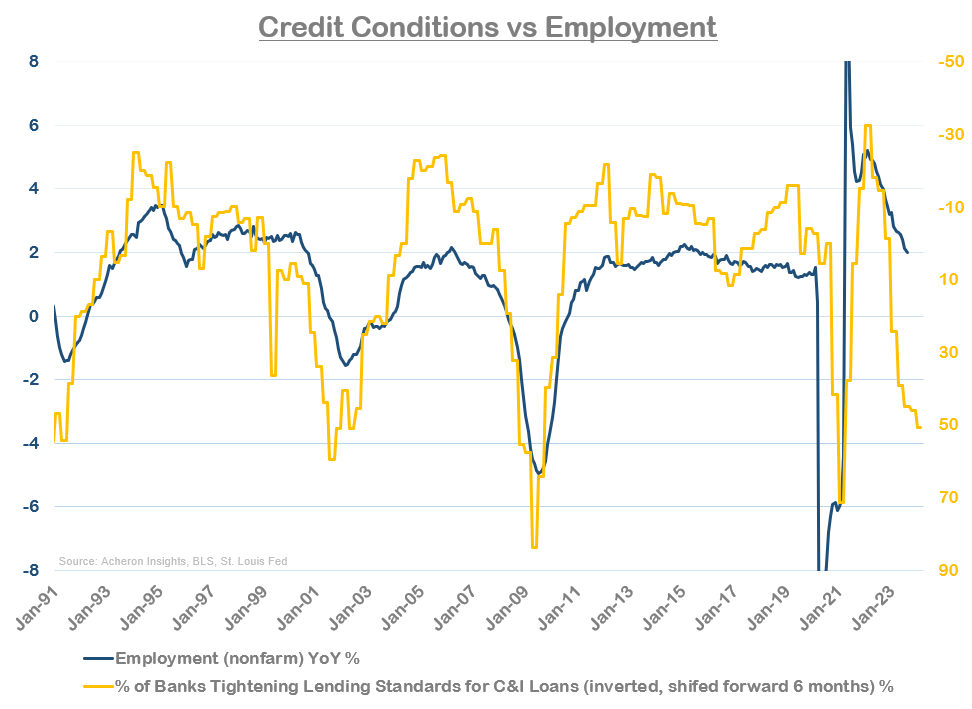
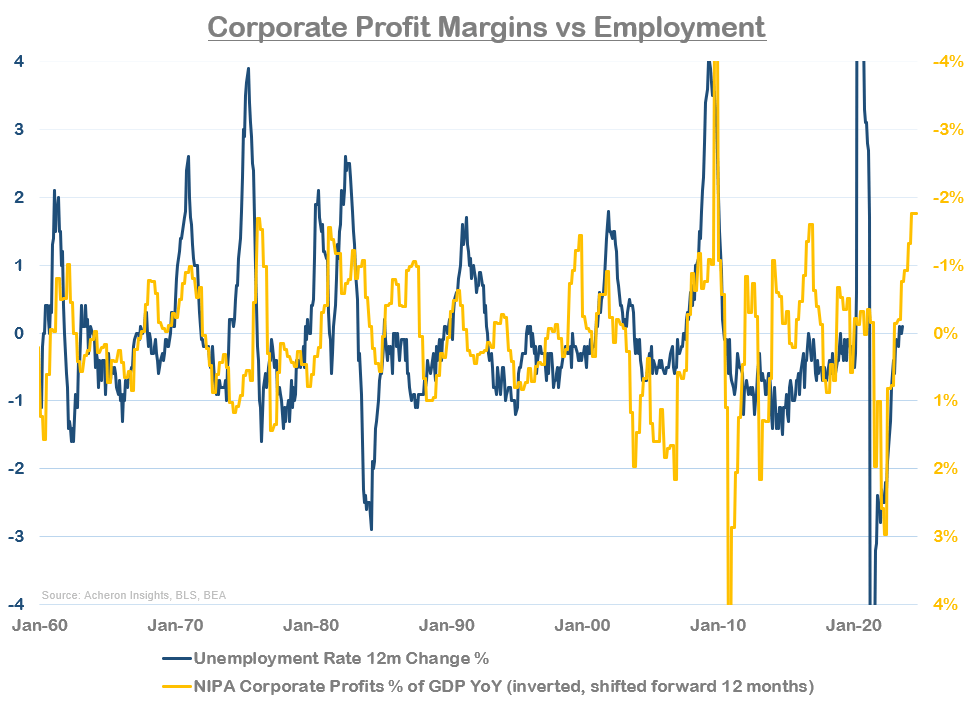
As growth slows, so does access to credit (generally at times when it is needed most). Tighter credit conditions strain profit margins, which eventually results in layoffs. This dynamic is illustrated below by comparing the percentage of banks tightening credit conditions (inverted) relative to employment growth.
As well as corporate profit margins (inverted below) versus the unemployment rate.
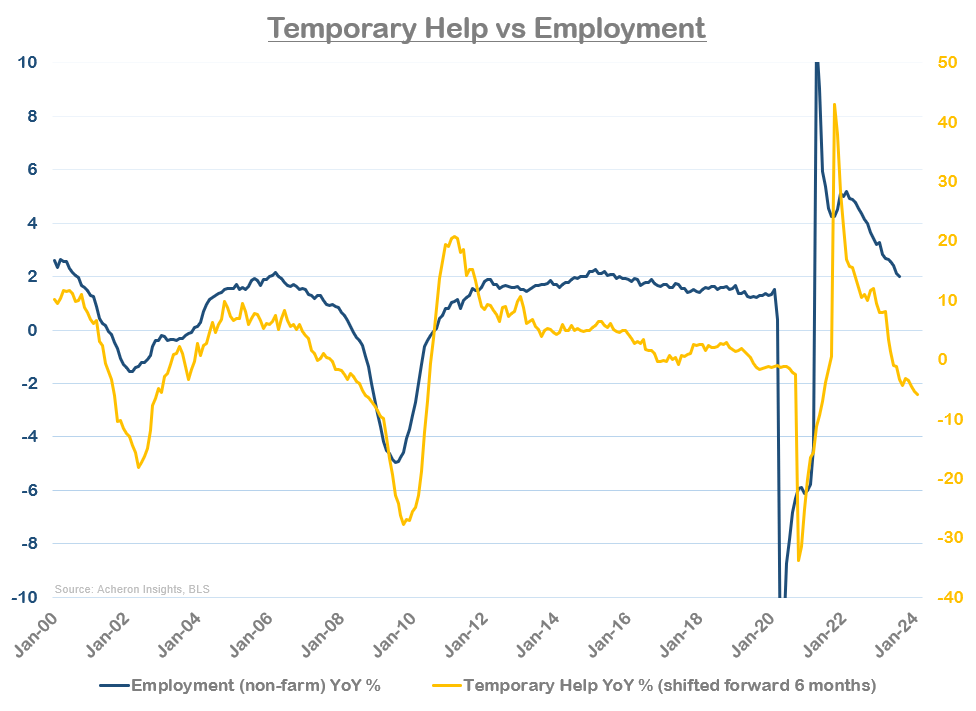
Employers will almost always lay off temporary employees before they lay off their full-time workers, hence why we see temporary help growth lead to overall employment growth by around six months. All these leading indicators of employment suggest the decline in growth is set to continue, with an outright contraction also a realistic outcome.
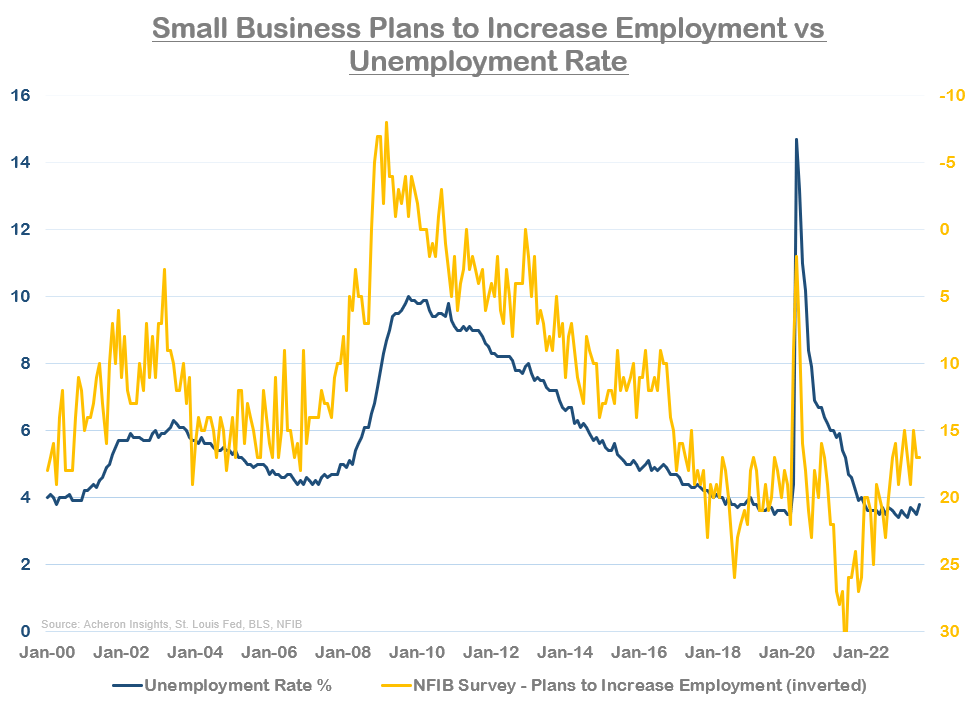
Other leading indicators of employment are sending similar messages. Per the NFIB Small Business Survey, the plans for small businesses to increase employment (inverted below) have been slowly trending lower since early 2022. Historically, this has led to a rise in the unemployment rate. However, it must be noted that while the plans to increase the employment index have fallen off its highs, it is yet to fall to levels representative of recent material spikes in unemployment, suggesting there still remains demand for workers by small businesses, which are in many respects the lifeblood of the US economy.
Meanwhile, measures of consumer sentiment and consumer confidence are sending a similar message. Both the University of Michigan’s Consumer Sentiment Survey and the Conference Board’s Consumer Confidence Index have trended lower over the past 18 or so months (particularly the former). Previous drops in consumer confidence have preceded spikes in unemployment, though the Conference Board’s measure of consumer confidence is still relatively robust in absolute terms.
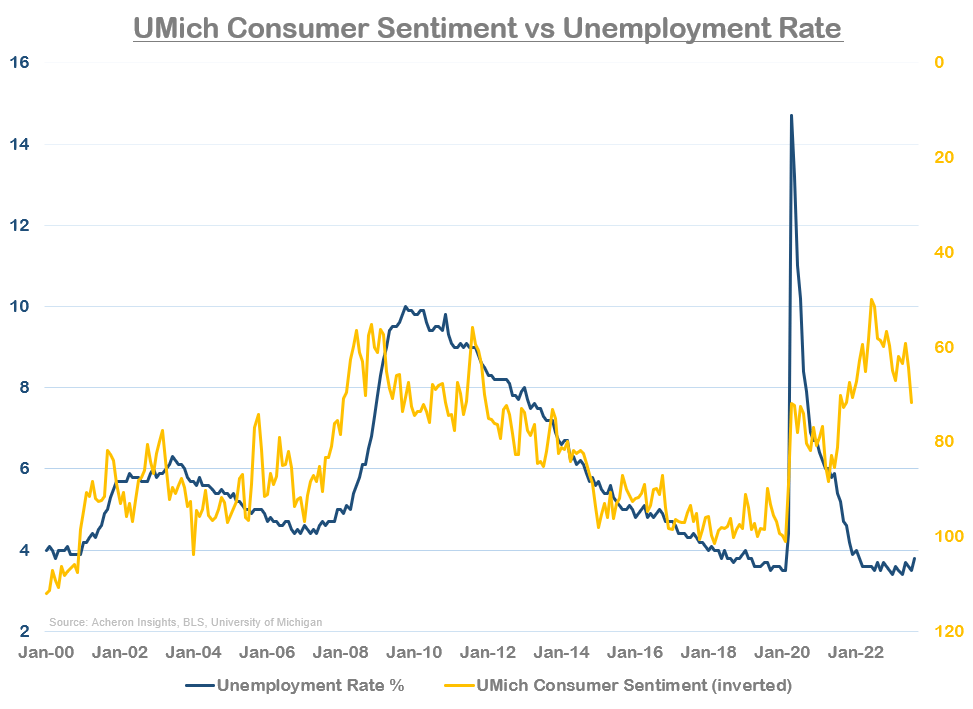
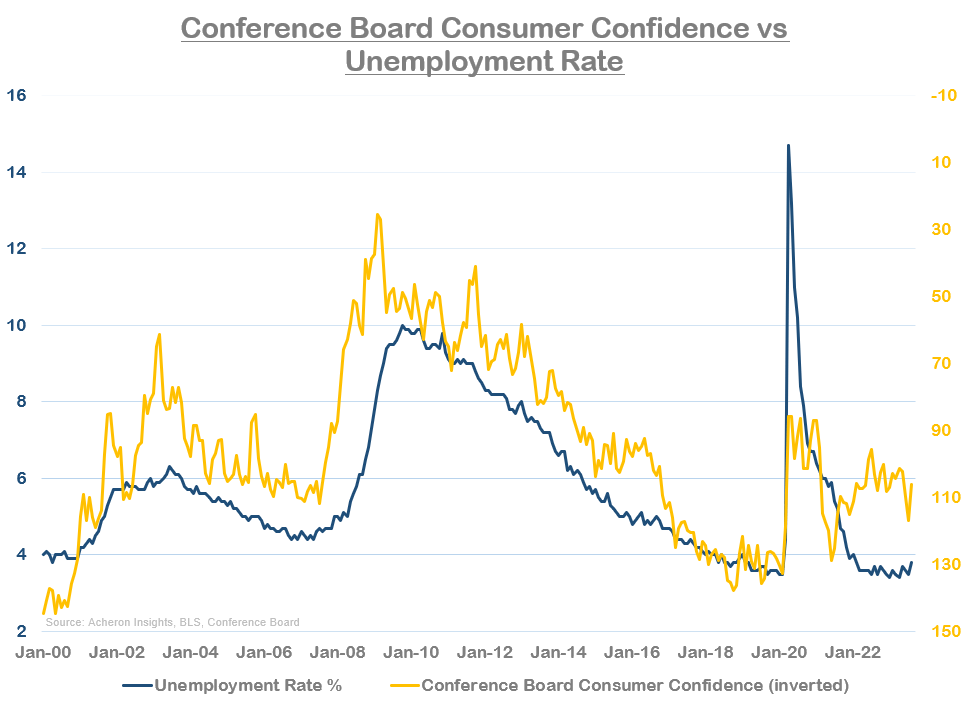
Though I generally avoid trying to justify an indicator, it is clear this cycle has seen survey data (particularly in relation to consumer confidence) being biased negatively by higher inflation rather than underlying economic or job market weakness, at least thus far.
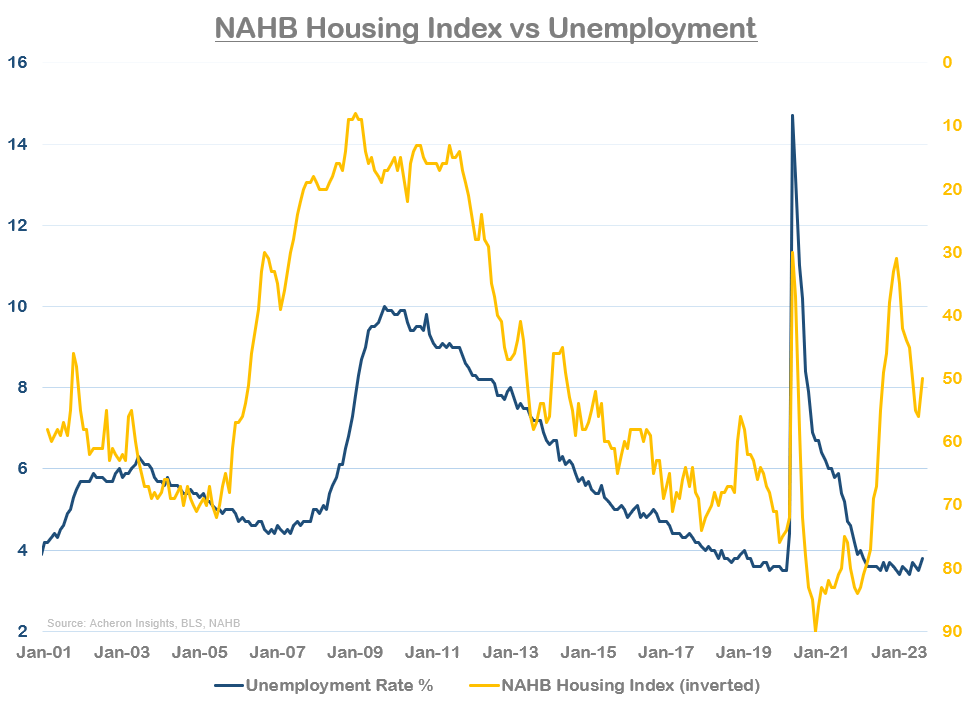
One metric that is signaling a material spike in unemployment is the NAHB Housing Index. This makes sense given housing and construction are one of the primary cyclical drivers of the US economy, and suggests the downward trend in construction employment is set to continue and accompany a rise in the overall unemployment rate.
Turning our attention now to wage growth, despite the current downward momentum in wage growth we have seen in recent months, it seems not all the leading indicators are suggesting this trend should continue – a worrying sign for policymakers.
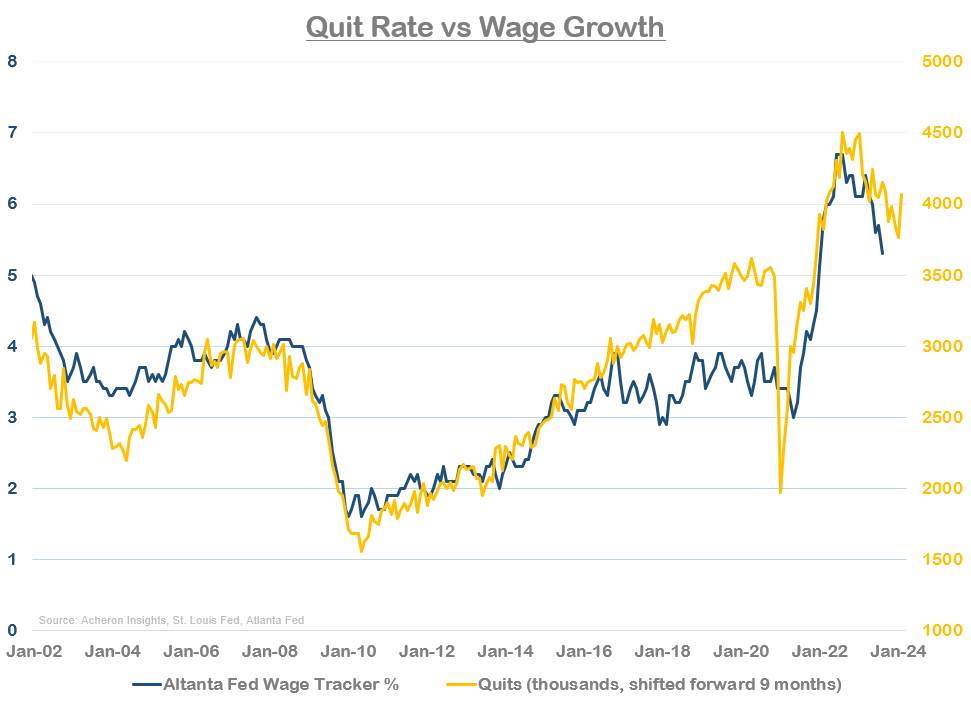
Indeed, while the number of workers quitting their jobs has been trending down throughout 2023, July saw a big spike in quits. Workers typically only quit their jobs if they can 1) afford to do so and are in a financial position whereby they do not need to work, or 2) are leaving their current employer for a higher-paying job elsewhere, hence why an increase in the number of quits generally signals a tight job market and thus leads wage growth by around nine months. As it stands, the deceleration in wage growth looks to have gotten a little ahead of the quit rate for now.
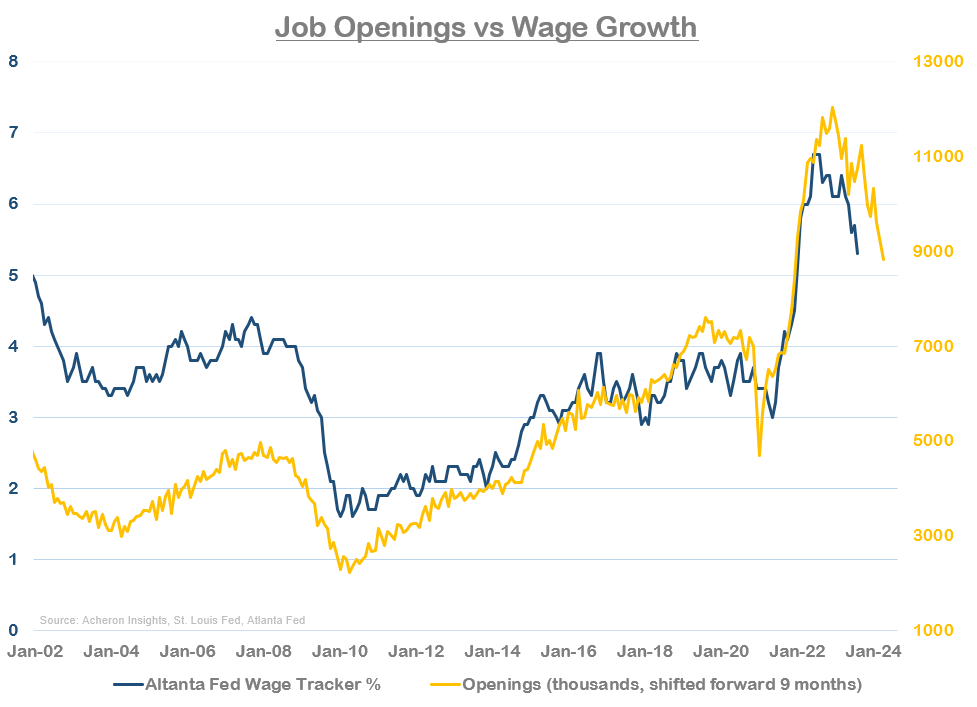
On the other hand, job openings (which are one way to illustrate the demand for labour) also lead wage growth by around nine months and have been trending lower to a material degree of late, confirming the downtrend in wage growth.
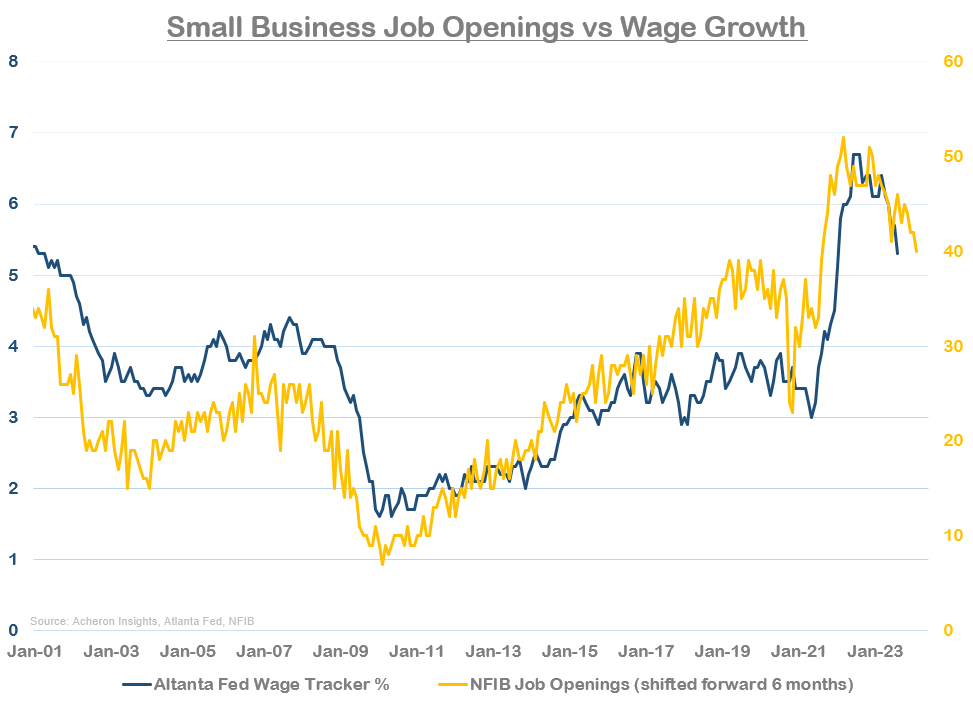
This trend in the BLS’ job openings data is being confirmed by the NFIB’s Small Business survey. Small business job openings have fallen in recent months, though wage growth seems to have already fallen in a commensurate fashion.
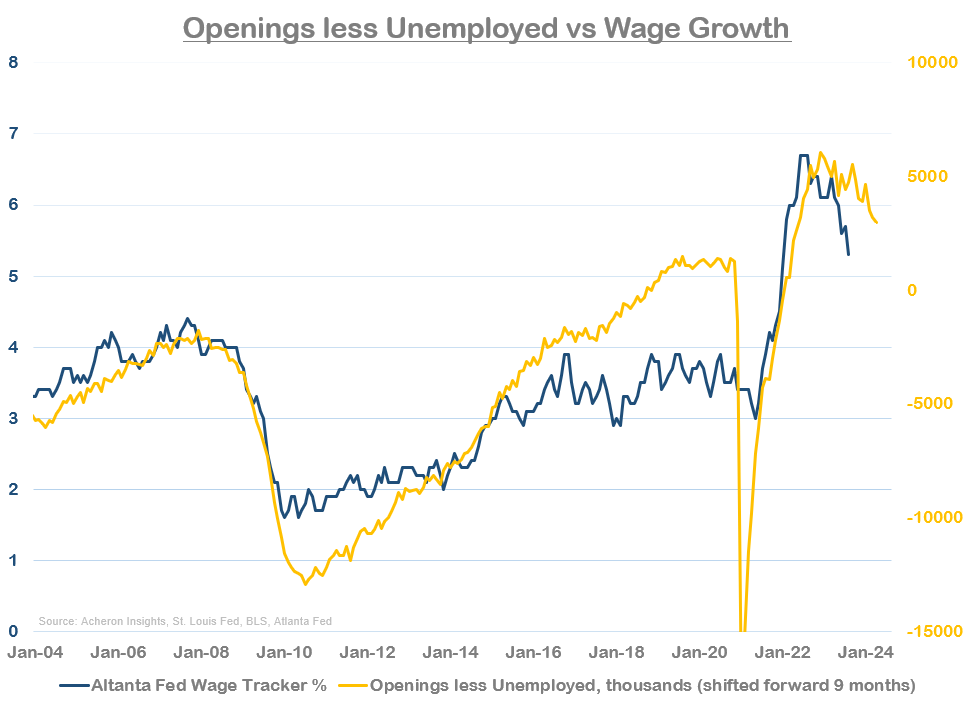
If we compare wage growth to total job openings net of total unemployed persons, a measure that also leads to wage growth by around nine months, this ratio is sending a similar message to that of quits. Wage growth should be falling, but perhaps not to the extent to which it has done so thus far.
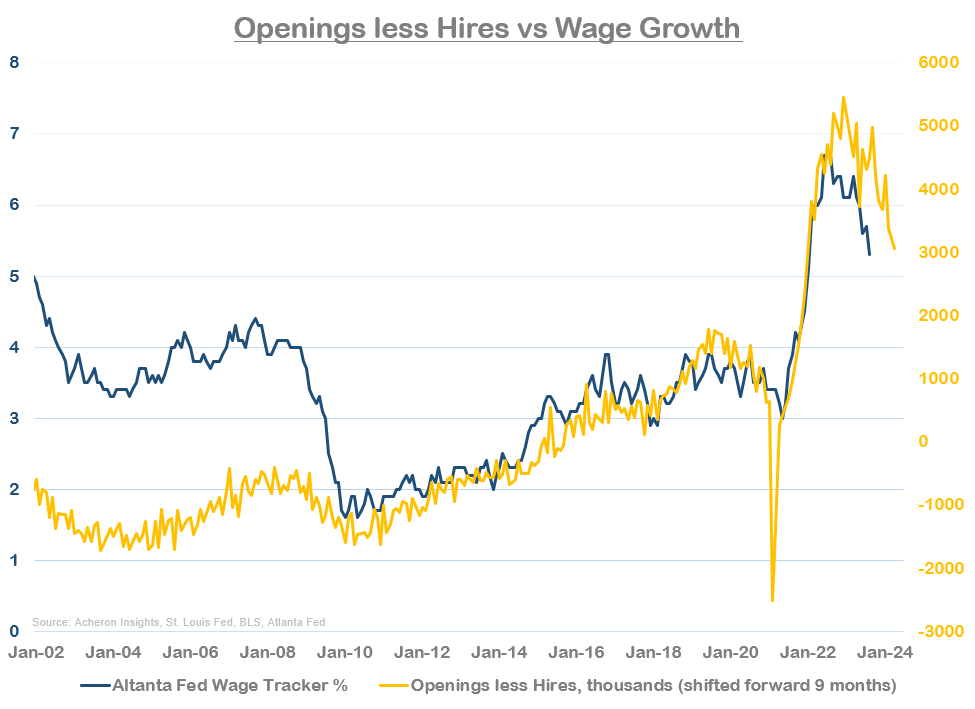
A similar signal can be gleaned from the relationship between total job openings net of new hires.
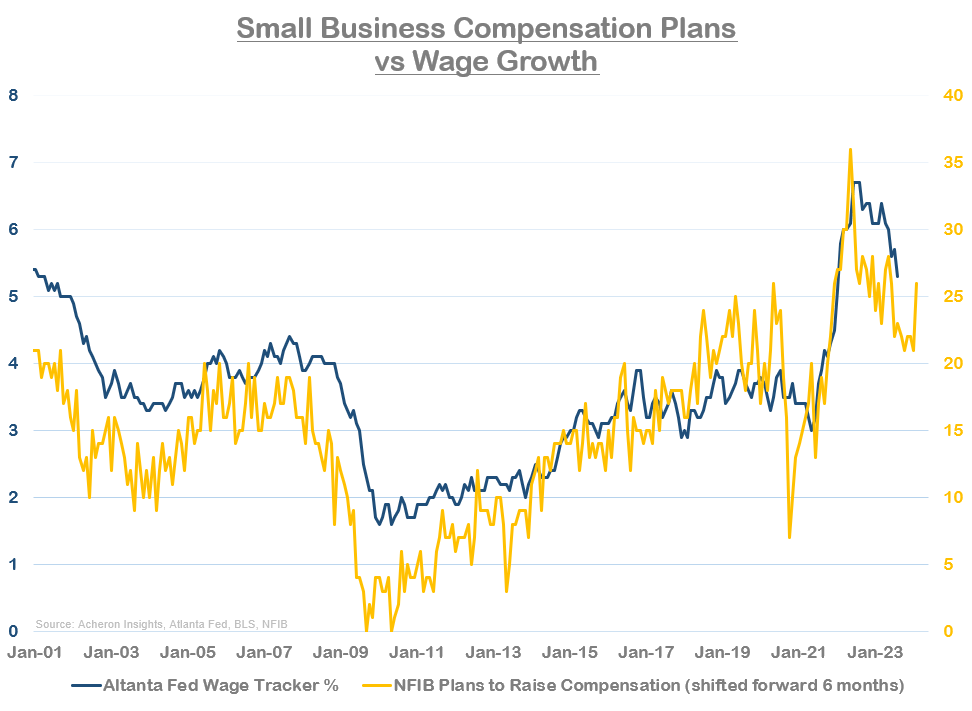
What is perhaps most concerning from the Fed’s perspective however is the recent uptick in the NFIB’s survey for Small Businesses Plans to Raise Compensation, which in August jumped meaningfully higher. Given the historical volatility of this data point, I doubt this is representative of a new move higher in wage growth, but rather highlights the deceleration in wage growth we have seen thus far may slow in the coming months.
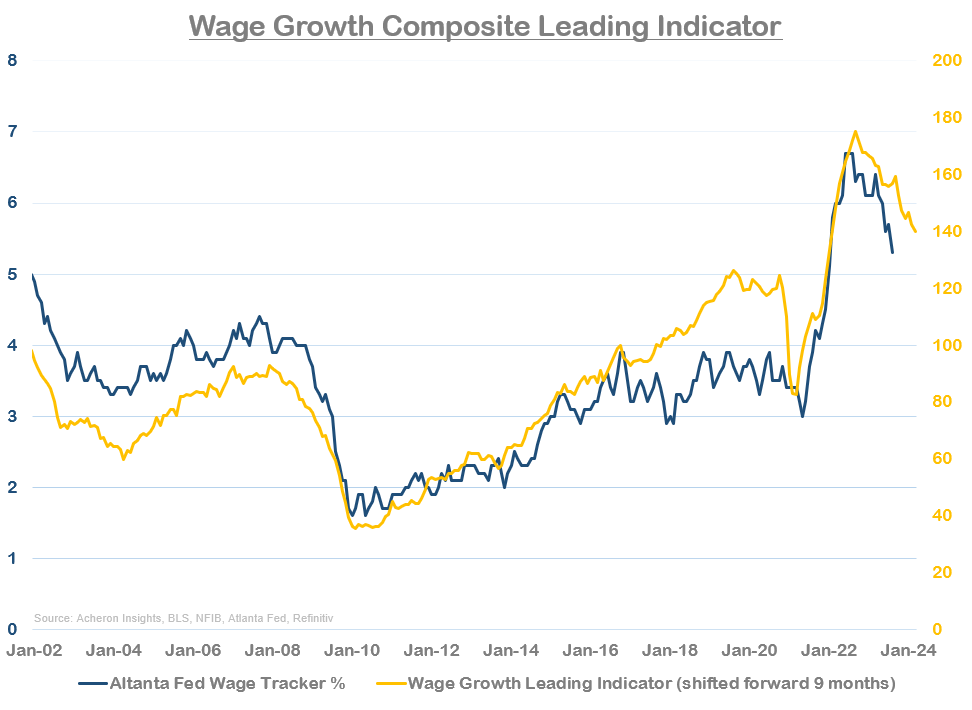
My compositive leading indicator for wage growth looks to confirm this overall thesis. The trend in wage growth will likely continue to the downside in the coming quarters as the outlook for employment is subpar but is likely to decelerate at a slower rate than we have seen in the last few months. We may even see a bounce in the Atlanta Fed’s wage growth tracker in the next month or two, an outcome that would no doubt strike fear in the hearts of J-Powell and Co.
Implications of the current jobs market
So, given it seems apparent the labour market is slowly cooling and we should expect to see the slow deceleration in employment and wage growth continue as we close out 2023 and enter 2024, the jobs market today remains far from levels that will appeal to policymakers, particularly from a wage growth perspective.
While the Fed will be happy with the recent trend lower in wages until we see wage growth and unit wage costs move meaningfully lower (which doesn’t seem likely this year per the leading indicators above), then this suggests services CPI (ex-owners equivalent rent) is likely to remain sticky given the close relationship between the two.
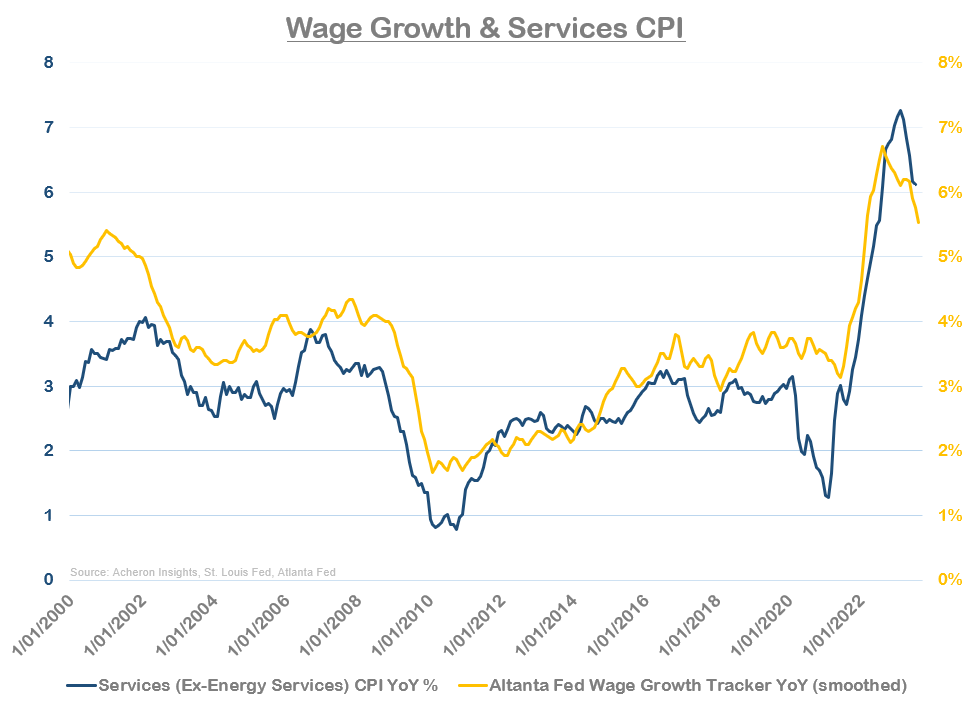
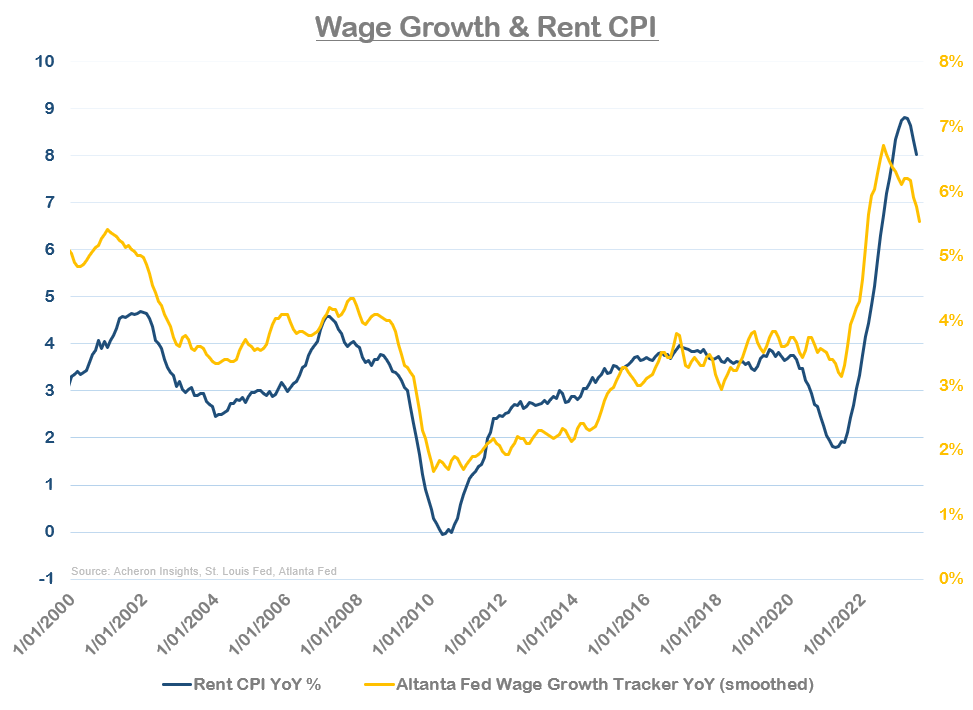
In fact, if wage growth were to bounce in the coming months then we shouldn’t rule out further rate hikes by the Fed (especially when considered in the context of my belief that goods disinflation may be over).
And while we know employment growth is likely to weaken from here, the current rate of unemployment continues to suggest further rate hikes may be warranted.

This is the problem with using lagging economic data as a key input to monetary policy decision-making. It is lagging and as a result, often leads to policy errors. We know the jobs market is likely to soften in the coming quarters, but current jobs market statistics such as initial claims, wage growth, and the unemployment rate are not yet indicative of such an outcome.
The Fed wants to get wage growth down without a material rise in unemployment and thus achieve its desired soft landing. I remain sceptical whether it can achieve this without a spike in unemployment that satisfies the NBER’s definition of a recession. The downward trend in non-farm payroll revisions highlighted earlier seems to suggest a recession could well be the eventual outcome, particularly if the Fed overtightens based on current employment data that is subsequently revised lower after the fact.
Variant Perception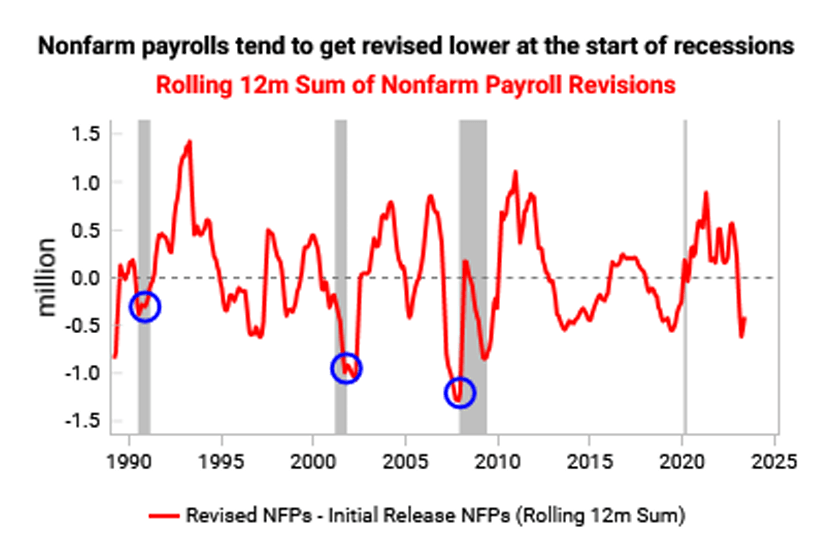
In terms of the equity market, the current status of the jobs market and the outlook for employment and wages continue to be representative of late-cycle dynamics. This is generally not the most favourable period to the overweight stocks and risk assets from a cyclical perspective, particularly as higher wage costs continue to pressure margins.
Variant Perception Peter Berezin – BCA Research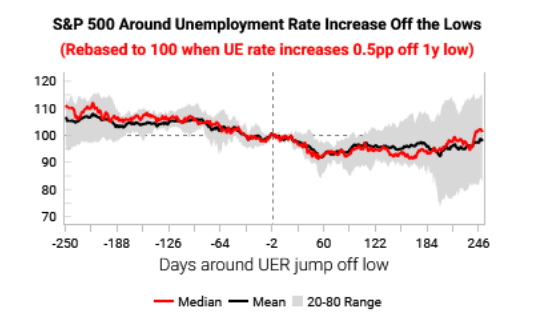
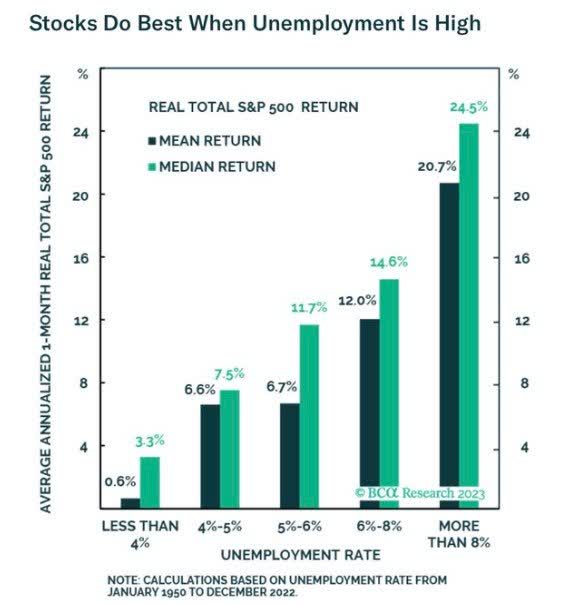
For now, the labour market remains relatively robust and is neither too hot nor too cold. Unemployment is low and wage growth is cooling but remains relatively high. As a result, this will continue to pressure policymakers to remain hawkish and likely lead to a policy error (again).
Looking ahead, the leading indicators of unemployment suggest we are likely to see a rise in the unemployment rate in the coming quarters (one that could potentially trigger a recession), while the leading indicators of wage growth suggest a modest deceleration in wage growth is likely over the medium term. Neither, however, is conducive to easy monetary policy in the short term.
Original Post
Read the full article here


