Small Cap US stocks are extremely undervalued relative to their large cap peers, considering their low PE ratio and long-term track record of faster earnings growth. Even after taking into account the impact of high profit margins, which are likely to mean revert lower, the S&P 600 Small Cap Index is a relative bargain on a trailing PEG ratio basis (price-to-earnings-to-growth). I remain long the iShares Core S&P Small-Cap ETF (NYSEARCA:IJR) and expect double-digit annual outperformance relative to the S&P500 over the coming years.
I last covered the IJR on June 5, arguing that a bullish breakout had occurred and while the ETF saw 10% upside over the next two months, it has once again fallen back into the middle of its year-long range. Over this period, the S&P500 has added another 5%, further strengthening the relative value case for small caps and the IJR.
IJR Vs S&P500 (Bloomberg)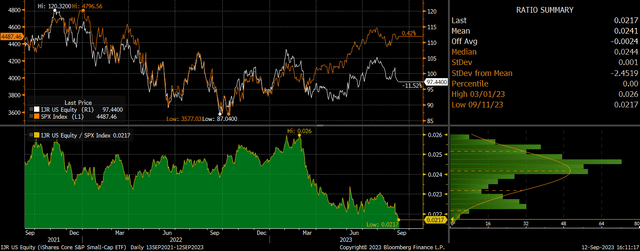
The IJR ETF
The IJR tracks a market-cap-weighted index of primarily small-cap US stocks. The S&P Committee selects 600 stocks representing about 3% of the publicly available market. The ETF has a significantly lower exposure to technology stocks and higher exposure to financial stocks when compared with large cap stock indices, which largely explains its recent underperformance. The IJR is far superior to the Russell 2000 ETF (IWM) as it has far stricter criteria regarding the profitability of firms included in the index, which has seen it outperform over the long term. The IJR also has a lower expense ratio of 0.06% versus the IWM’s 0.19%. The dividend yield on the IJR is currently 1.6% after expenses, while the S&P 600 Small Caps index yields 2.0%.
Growth At A Reasonable Price
The PEG ratio measures the price to earnings ratio of a stock or index relative to its expected historical or expected growth, with the idea being that a market with strong growth justifies a higher PE ratio all else equal. It has often been said that a PEG ratio of 1 represents a fair trade-off between the values of cost and the values of growth, indicating that a stock is reasonably valued given the expected growth. However, the figure itself is less important than the difference between markets, and at present the IJR offers investors a strong growth track record at a very reasonable price.
S&P600 Small Caps Vs S&P500 EPS Rebased to 2003 (Bloomberg)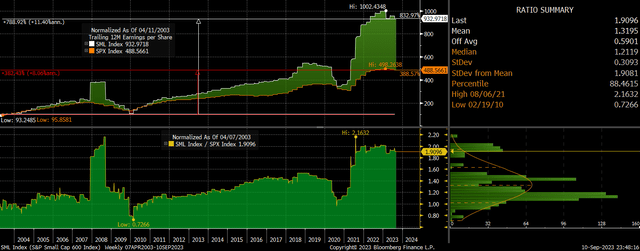
The IJR has typically trades at a valuation premium to the S&P500 because of its faster growth rate, earnings per share growing by 11.4% annually over the past 20 years compared to 8.1% for the S&P500. Over the past few years, however, this has changed significantly. Despite the long-term growth outperformance, small cap stocks are now trading at a discount to their large cap peers. The trailing PE ratio of 16x is now a record 6pp below that of the SPX, compared to a historical average premium of 5.5pp. The IJR therefore has a PEG ratio of just 1.4x compared to 2.6x for the S&P500.
S&P600 Small Caps Vs S&P500 PE Ratio (Bloomberg)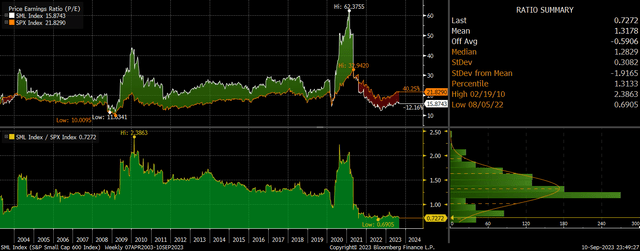
US small cap profits have risen much faster than sales over the past two decades and this is highly unlikely to continue over the coming years, which means growth in sales per share may be a better indicator of sustainable earnings growth. Similarly, high profit margins have also depressed the PE, and so ideally a cyclically-adjusted PE ratio should be used as the numerator. These figures are shown below for various US and international markets using data over the past 20 years. As you can see, small cap and mid cap stocks stand out as being particularly cheap relative to their historical growth even after adjusting for current elevated profit margins.
Bloomberg, Author’s calculations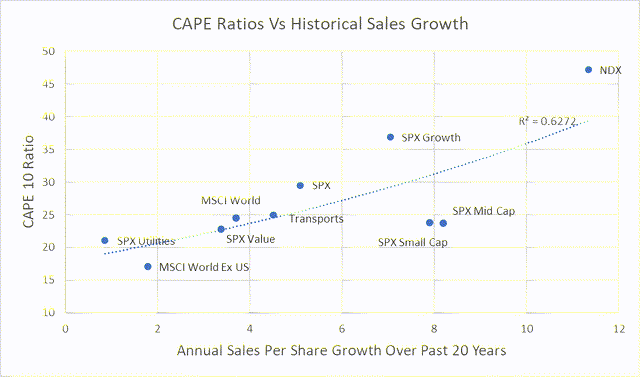
The IJR is therefore either an extremely attractive relative value opportunity or the long-term growth outperformance is set to reverse. I fully expect small cap earnings growth to slow sharply over the coming years due to a combination of slower nominal GDP growth and profit margins mean revert lower from current highs. However, it is difficult to imagine a sustained period of small cap earnings underperformance as smaller companies as they do not have the same constraints that large companies do in terms of slowing US nominal GDP growth. Even if earnings per share growth for the SPX 600 Small Caps slows in line with that of the S&P500 over the coming years, the IJR’s valuation premium suggests outperformance.
The Higher Dividend Yield Adds An Element Of Safety
Small cap stocks such as those represented by the IJR have tended to have lower dividend yields in the past relative to large cap stocks for two reasons. Firstly, their higher growth rates have resulted in higher valuations and therefore a lower dividend yield all else equal, and secondly, the need for capital expenditure to fund growth has come at the expense of dividend payments. At present, however, small cap valuations are so depressed that the S&P600 Small Cap dividend yield is above that of the S&P500. Over 30 years of data, the S&P600 Small Cap dividend yield has averaged around 0.7% below the SPX and it is now 0.4% above it.
S&P600 Small Cap Vs S&P500 Dividend Yield (Bloomberg)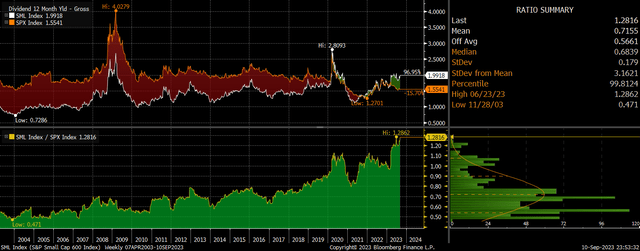
The main explanation for this small cap discount is career risk. The popularity of mega-cap tech stocks means that portfolio managers cannot afford to be underweight and risk being the only ones who missed out. This extreme herd behavior in favor of mega-caps and against small caps is reminiscent of the late-1990s. The ratio of the S&P600 Small Cap index over the SPX hit a trough in April 1999 when the valuation discount was almost as large as it was today. Over the following 3 years small caps outperformed by 100%. I fully expect the IJR to resume its long-term outperformance versus the S&P500 over the coming years, with 10% annual outperformance to be expected over the next decade.
Read the full article here


