In a recent quarter, Morgan Stanley (NYSE:MS) recorded a marginal increase in net revenues compared to the same quarter from the previous year. However, its net income showed a dip, influenced by a notable severance cost due to an employee-related decision. The institution’s performance presented mixed results across its segments. One segment declined due to reduced client engagement and market volatility, while another achieved record net revenues. This piece offers a technical examination of Morgan Stanley’s stock price to forecast its future trajectory and identify investment prospects. Observations indicate that, although the stock price fluctuates within broad boundaries, the long-term trend is decisively bullish.
Financial Performance of Morgan Stanley
Morgan Stanley experienced a slight uptick in net revenues for the second quarter of 2023, totaling $13.5 billion compared to the $13.1 billion recorded in the same quarter the previous year. The net income was $2.2 billion, translating to $1.24 per diluted share. This indicates a dip from the $2.5 billion or $1.39 per diluted share in the prior year. Notably, the figures for Q2 2023 included a significant severance cost of $308 million due to an employee action.
Institutional Securities recorded $5.7 billion in net revenues, a decline from the $6.1 billion of the previous year. Factors influencing this performance include a dip in Advisory revenues, primarily due to fewer completed M&A transactions, and decreases in Equity and Fixed Income revenues due to lower client activity and reduced market volatility. Offsetting this were increases in Equity and Fixed-income underwriting revenues. Overall, the pre-tax income for Institutional Securities dropped to $1.0 billion from $1.6 billion year-over-year.
However, the Wealth Management sector showcased impressive results, with a record net revenue of $6.7 billion, marking an increase from $5.7 billion the year before. Despite a 2% decrease in asset management and transactional revenues, the segment benefited from a surge in net interest income due to higher interest rates. However, there was a notable increment in compensation expenses, mainly due to the mentioned severance costs and deferred compensation plans. The pre-tax income for this division was $1.7 billion, resulting in a pre-tax margin of 25.2%.
This division saw a decrease in net revenues, which totaled $1.3 billion, down by 9% from the previous year. The decline was attributed to a drop in asset management and related fees, primarily because of the lower average Assets Under Management (AUM) from the previous year.
The financial environment remains challenging, as indicated by the firm’s ROTCE of 12.1% and an expense efficiency ratio of 75% for the first half of the year. The quarter’s expenses were significantly influenced by the $308 million severance costs and an additional $99 million in integration-related expenses. On a brighter note, Wealth Management reported net solid new client assets of $90 billion, and the Standardized Common Equity Tier 1 capital ratio was robust at 15.5%.
A Deep Dive into Technical Projections
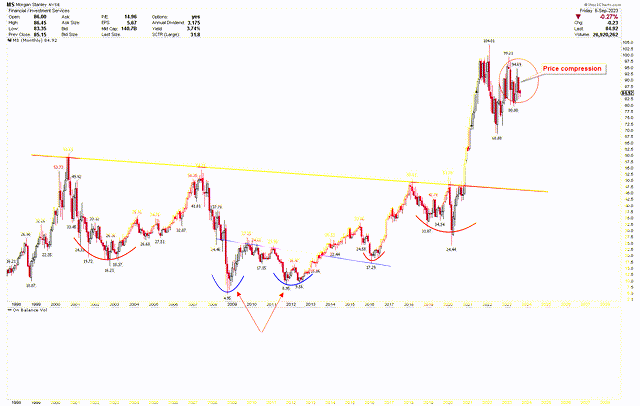
The Morgan Stanley monthly chart demonstrates consistent consolidation over the past two years. Yet, between 2000 and 2020, a sturdy foundation was established for the company, marked by the appearance of the inverted head and shoulders pattern. This pattern has been a foundational signal, suggesting a robust bullish trajectory for Morgan Stanley in the long haul. The head of this formation corresponds to the 2008 low at $4.95, while the shoulders align with the $16.21 and $17.29 levels and the neckline between $50 and $60. A notable surge was seen for Morgan Stanley when it surpassed the $60 mark, accelerating its momentum to reach an all-time high of $104.01.

MS Monthly Chart (stockcharts.com)
This upward movement was predominantly seen in 2020 and 2021 when Morgan Stanley experienced significant shifts due to various factors. The abrupt downturn in early 2020, triggered by the global emergence of COVID-19, eventually gave way to a strong resurgence due to unique monetary policies, fiscal incentives, and global central bank maneuvers. The subsequent optimism surrounding vaccine rollouts in late 2020 and 2021 amplified the market’s positive outlook. The swift adaptation to digital means, the durability of the tech sector, and shifts to remote working further fueled market surges, particularly in tech-centric indices. Morgan Stanley’s diverse nature of its ventures, digital integration, and certain favorable trading circumstances also played a role in elevating stock values.
Nevertheless, Morgan Stanley’s stock encountered significant resistance at the $104.01 mark before being corrected. Currently, the stock is navigating expansive market boundaries, hinting at vulnerability. If an upward breakthrough doesn’t materialize, there’s potential for further deterioration. However, long-term price trends suggest that any downturn could be a promising buying opportunity for long-term stakeholders. A critical long-term support zone is identified between $50 and $60, corresponding to the neckline of the bullish pattern.
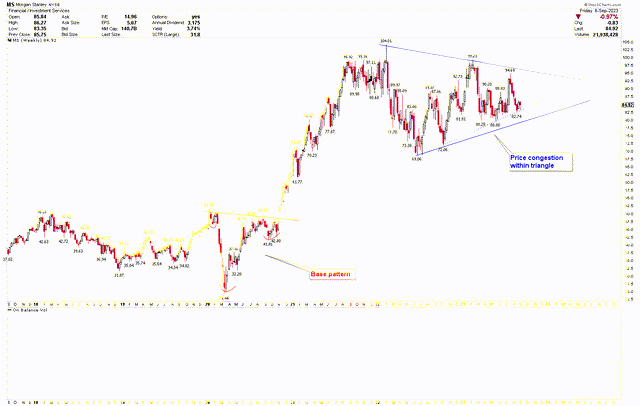
Diving deeper into the bullish configuration, the subsequent weekly chart showcases a triangle of price corrections, with the consolidation hovering between $69 and $104, indicating indecision. This triangle, delineated by the blue trend line, will help predict Morgan Stanley’s subsequent trajectory. A weekly chart reveals another inverted head and shoulders pattern stemming from the 2020 and 2021 surge, reinforcing the idea that a price dip could be an ideal purchase moment for Morgan Stanley. The blue triangle suggests a fall below $69 could lead to further descent toward the robust $50-$60 support.

MS Weekly Chart (stockcharts.com)
The daily chart below further highlights the blue trend line, indicating that the price rebounded from near-term support and showed bullish tendencies. Investors might consider holding off until the price settles from its consolidation phase. A monthly close over $100 could trigger a significant upward shift. However, dipping below $69 might suggest a further decline, possibly reaching the sturdy $50-$60 support zone.
Market Risk
A decrease in net revenues for the Institutional Securities segment, attributed to diminished client activity and market volatility, suggests a potential downturn in primary income-driving sectors, which might affect future earnings. Furthermore, the hefty severance expense of $308 million, alongside $99 million in integration-related costs, could dent short-term gains and influence investor perceptions. Additionally, the decline in Asset Management revenues, particularly with the reduced average AUM, raises concerns for financial institutions, suggesting potential diminishing investor confidence or operational hurdles.
From a technical perspective, Morgan Stanley’s stock shows signs of fragility. Even with the stock’s bullish trajectory from 2000 to 2020, it met resistance at $104.01 and then corrected. The current stock dynamics hint at instability due to strong oscillation, and unless there’s a solid upward push surpassing $100, the stock could face further declines. Notably, there’s a crucial support bracket between $50 and $60, and any descent below pivotal points like $69 might push the stock further into this range.
Bottom Line
Morgan Stanley’s recent quarterly report reflects a nuanced financial performance. While there was a minor increase in net revenues, it was offset by a decline in net income, primarily due to significant severance costs stemming from an employee decision. Diverse outcomes were evident across its segments, with some experiencing growth and others a decline. Remarkably, the Asset Management sector’s revenue drop, likely due to operational challenges or reduced investor confidence, warrants attention. Despite two decades of consistent bullish momentum in the stock market, the bank’s shares now exhibit vulnerability, facing resistance at $100. If this resistance isn’t overcome, there’s potential for the stock to fall further. While long-term trends indicate this could be a buying opportunity, short-term patterns advise caution, suggesting potential downward shifts if specific markers aren’t met. Investors may consider holding off on decisions until market fluctuations stabilize. Conversely, surpassing the $100 mark could trigger a significant upward surge.
Read the full article here


