Research Summary
Today I’ll be rating Stifel Financial (NYSE:SF), in the financials sector, investment banking & brokerage subsector.
It had its Q2 earnings result on July 26th and I will do a deep dive into some of that data today as well.
For readers less familiar with this company, here are relevant points from their website: roots go back to 1890, a focus on investment banking & wealth management, trades on the NYSE, based in St. Louis Missouri, has 400+ offices nationwide. Also to mention is the fact that it has a major equities research group as well.
Two key peers of this company are Jefferies Financial (JEF), and Evercore (EVR).
Rating Methodology
Using a process similar to 5 project phases in project management, I break down my overall holistic rating of this stock into 5 categories I rank individually and of equal weight: dividends, valuation, share price, earnings growth, financial health.
If I recommend this stock on at least 3 of 5 categories, it gets a hold rating. 4 of 5 get a buy, and less than 3 get a sell rating. Then I compare my rating to the consensus from analysts, Wall Street, and the quant system.
Dividends
In this category, I will analyze the dividends of this stock and whether I think they present an opportunity for dividend-income investors. The data comes from official Seeking Alpha dividend info.
As of the writing of this analysis, the forward dividend yield is 2.22%, with a payout of $0.36 per share on a quarterly basis, with the most recent ex-date being Aug. 31st.
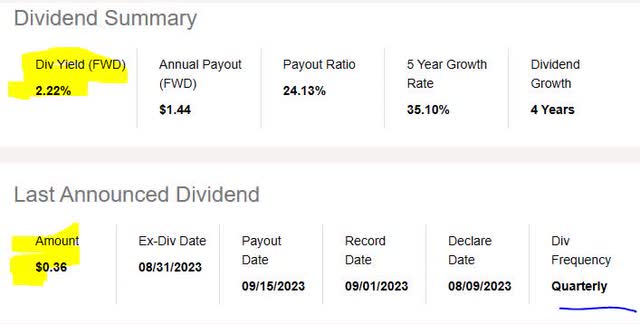
Stifel – dividend yield (Seeking Alpha)
When comparing to its sector average, this dividend yield is 44% below its sector average. I believe this is a negative point to consider for dividend investors who are comparing multiple stocks in which to invest. I think a reasonable range would be 2.5% – 4.5% dividend yield, so Stifel’s yield is just below my target range.
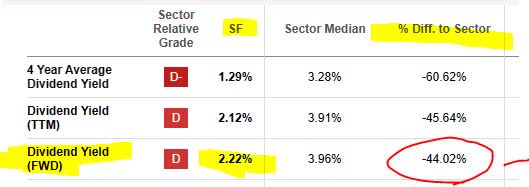
Stifel – dividend yield vs sector average (Seeking Alpha)
On a more positive note, however, in looking at the 5 year dividend growth for this stock, it has shown a positive upward trend. This is, in my opinion, a positive point for dividend investors and a sign of this firm’s capacity to return capital back to shareholders.
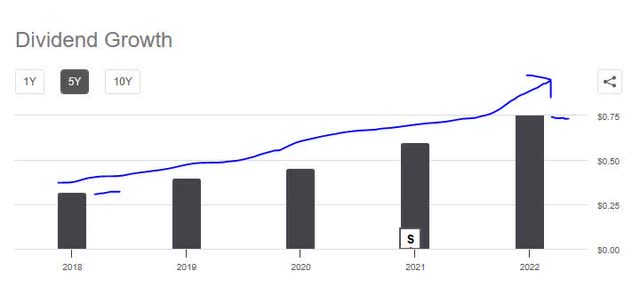
Stifel – 5 year dividend growth (Seeking Alpha)
Additionally, I am looking for stability with dividend payouts, and this stock has shown regular dividend payment history lately, which is a positive point to think about.
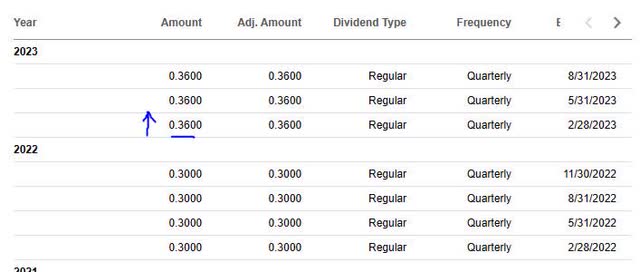
Stifel – dividend history (Seeking Alpha)
I think the stable dividend history and growth offsets the fact that the yield is lower than the sector average. On the whole, I would recommend this company on the category of dividends. However, later in the section on share price, I will show how this dividend yield can be used in an investment idea for this stock.
Valuation
In this category, I will analyze the valuation of this stock. The data comes from official valuation info on Seeking Alpha, specifically the forward P/E ratio and forward P/B ratio, the key metrics I look at.
This stock has a forward P/E ratio of 10.79, which is 12.76% above its sector average. I think that a reasonable price to earnings for this stock would be between 7.5x earnings and 10.5x earnings, to stay within a reasonable 2 point range of the average. In this case, on this metric the stock appears moderately overvalued vs its overall sector. I don’t believe it is major cause for concern.
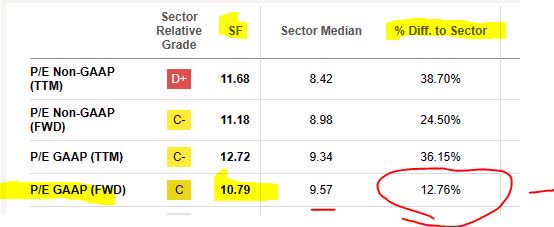
Stifel – P/E ratio (Seeking Alpha)
This stock has a forward P/B ratio of 1.39, which is 42% above its sector average. I think that a reasonable price-to-book value for this stock would be between 0.50x book value and 1.5x book value, to stay within a 1/2 point range of the average. In this situation, this stock appears only slightly overvalued vs its overall sector, and so I would consider a price to book in this range as reasonable and not of major concern.

Stifel – P/B ratio (Seeking Alpha)
Let’s take a look at one of its peers mentioned earlier: Jefferies Financial. Incidentally, I also rated that stock not long ago as well. If comparing the two, Jefferies has a price-to-earnings that is 180% above the sector average and a price-to-book 9% below the average. So, it seems a lot more overvalued than Stifel on price to earnings but more undervalued on price to book.
Based on the examples I gave, I would recommend this stock on the basis of valuation, using the two metrics provided.
Share Price
In this category, I will use a very simplistic investment idea to determine if the current share price presents a value buying opportunity right now or not.
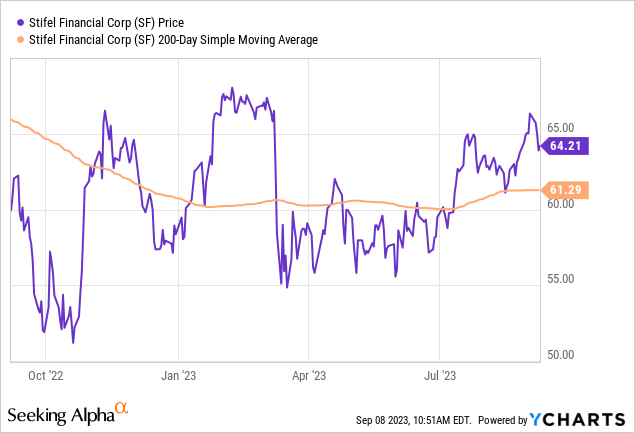
First, I pulled the chart (as of the writing of this article, so the price shown is not real time!) which shows a share price of $64.21, compared to its 200-day simple moving average “SMA” of $61.29, over the last 1 year period.
Second, I determine what my goal is for return on capital and what my risk tolerance is for capital loss if I buy 10 shares at the current share price and hold for 1 year to also earn a full year of dividend income.
My goal is positive +10% return on capital, and my risk tolerance is a -10% negative return on capital.
After holding for 1 year, I plan to sell the 10 shares. The following simulation tests what happens if the share price I sell at in Aug. 2024 is +10% above the current SMA, and what happens if it has dropped to -10% below the current SMA:

Stifel – investing idea (author analysis)
In the above example, I missed my profit goal by 1.08% and also exceeded my loss limit by 0.17%.
With that said, the current share price does not present a buy opportunity and in my opinion I would not recommend it. However, readers should still run their own simulations based on their individual portfolio goals which I cannot advise on here, as their risk tolerance and profit goals my differ from this idea above. It is simply a framework with which to think about potential gains & losses if buying at the current price.
Also, note that the above idea can create two potential tax events: dividend income and capital gains. This ought to be discussed further with your tax pro for consultation on this topic.
Earnings Growth
In this category, I examine the earnings trends comparing the most recent quarterly results to the same quarter a year ago, including both top-line and bottom-line income, and other relevant topics to earnings I think should be discussed for my readers.
On a YoY basis, this firm showed positive growth in a key area, net interest income, or the difference between interest revenue & expense. This correlates with the period of time when the market has seen record high rates, so I would say the rate environment has favored this firm, and I think will continue to do so as rates are not dropping anytime soon.

Stifel – net interest income (Seeking Alpha)
Turning to their earnings commentary to get more insight on this, in the wealth management segment:
Net interest income increased 42% over the year-ago quarter driven by higher interest rates and loan growth.
Regarding total top line revenue, however, the results were a little less bright, with a slight YoY drop, although nothing major.

Stifel – revenue YoY (Seeking Alpha)
On a YoY basis, the firm also showed negative growth in net income, which is modestly concerning.

Stifel – net income YoY growth (Seeking Alpha)
To help me understand what the driver was behind these losses, it appears the weakness comes from their institutional business segment.
According to their commentary:
Advisory revenues of $86.6MM decreased 57% from the year-ago quarter driven by lower levels of completed advisory transactions.
Drilling down further, we see the areas of the institutional segment that are causing headwinds to earnings. Offsetting it are stronger results from equity capital and fixed income capital raising activities, however overall this institutional segment was loss-making in Q2.
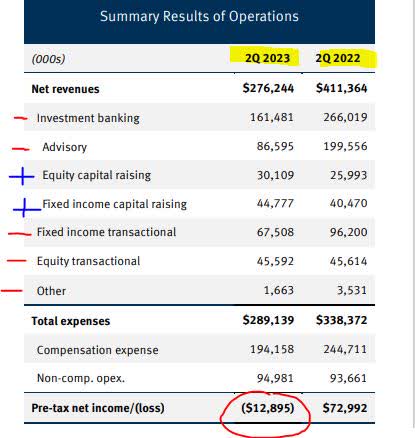
Stifel – q2 results – institutional (company earnings release)
Based on this evidence, I would not recommend the stock in this category, and await better earnings results for Q3.
Financial Health
In this category, I will discuss whether this company shows strong financial fundamentals in the realm of capital, liquidity, and overall balance sheet & cashflow topics.
The following are relevant data points coming from the company’s own Q2 presentation.
First, I want to point out that since 2019 the firm has had a positive uptrend in bank-driven funding, which I think is a good sign of deposit growth.
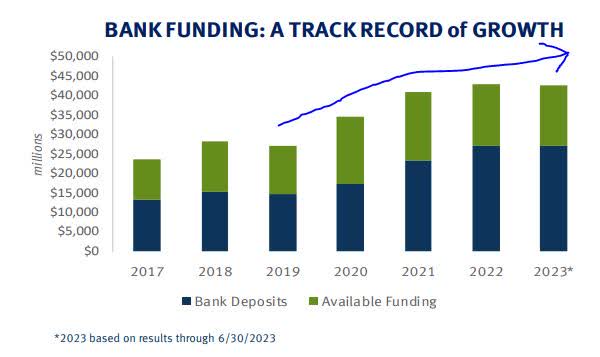
Stifel – bank driven funding (company q2 presentation)
Next, I want to point out that this firm’s tier 1 risk based capital far exceeds the regulatory 6% standard, and I think considering this has been the case for many quarters it is another sign this firm has strong financial health, with a 17.3% tier 1 risk-based capital ratio in Q2.
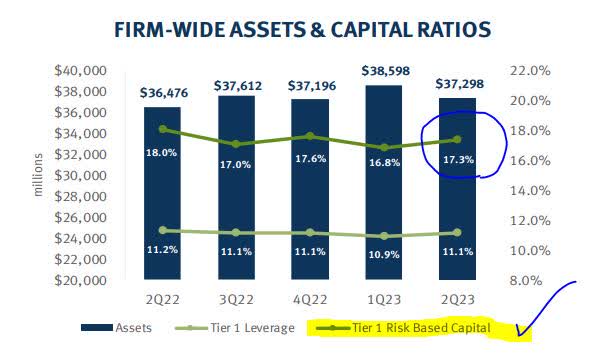
Stifel – tier 1 capital (company Q2 presentation)
Also to mention is that, according to the company in the Q2 earnings result, they “repurchased 1.5MM shares with 6.1MM shares remaining on current authorization.
Usually, a firm that is struggling with liquidity will pause share repurchases and dividend payouts until things improve, which this firm has not done but continues to repurchase shares.
I would therefore recommend this category, based on the evidence found.
Rating Score
Today, this stock was recommended in 3 of my rating categories, earning a hold / neutral rating from me today. This is less bullish than the consensus from analysts and agreeing with the consensus from the quant system.
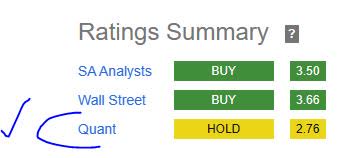
Stifel – rating consensus (Seeking Alpha)
My Rating vs Downside & Upside Risk
My neutral rating can face the following downside risk:
Continued headwinds in the investment banking space, which could cause investors and analysts to be increasingly bearish on stocks that are heavy in the investment banking space.
For example, an article this week in The Financial Times highlighted the investment banking headwinds this year even at Goldman Sachs (GS):
In January it cut roughly 3,200 jobs, or 6.5 per cent of its workforce, in an effort to reduce costs following a dramatic slowdown in investment banking activity..
My rating can also face the following upside risk:
Record growth as a leading wealth manager, which could convince many investors & analysts to be even more bullish on this company, making my neutral rating seem overly cautious.
Consider the following table showing Stifel’s growth in assets under administration, the number of financial advisors it has, and fee-based client assets. It is looking after some very big numbers, and earlier I mentioned the vast number of branches it has across the US with a focus on face-to-face client advisory. I think it could be a force to be reckoned with in the wealth space.
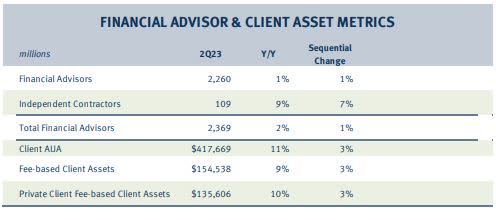
Stifel – wealth mgmt growth (company q2 presentation)
However, I maintain my hold/neutral rating despite the above upside and downside risk, as I think what outweighs those factors is for example the wealth management space also has massive competition from much bigger players like Morgan Stanley (MS) and others, and I think the investment banking headwinds will calm and deals will return.
This was echoed again by Goldman CEO David Solomon in today’s financial media story:
Goldman Sachs CEO David Solomon said in a Friday interview with Yahoo Finance that he is encouraged by a string of initial public offerings expected in the coming weeks, predicting a “pickup in the capital markets activity” over the course of the fall.
Analysis Wrap up
To wrap up today’s discussion, here are the key points we went over:
This stock got a hold rating today.
Its positive points are: dividends, financial health, valuation.
The headwinds it faces are: share price, earnings YoY growth.
Both upside & downside risks have been addressed.
In closing, I recommend adding this stock to a watchlist of financial-sector stocks, and particularly a watchlist that is diversified in this sector such that it includes some asset managers, insurance firms, global banks and regional ones too. It’s clear as day, there is money to be made in “managing” money of others.
Read the full article here


