A Quick Take On Cars.com
Cars.com Inc. (NYSE:CARS) reported its Q1 2023 financial results on May 4, 2023, beating revenue but missing EPS consensus estimates.
The firm operates an online marketplace connecting buyers and sellers of used cars in the U.S. and providing other related value-add services.
Given increasing economic slowdown risks, reduced credit availability concerns and an apparently mostly-full valuation of Cars.com Inc. at its current level, I’m Neutral [Hold] on CARS stock in the near term.
Cars.com Overview & Market
Chicago, Illinois-based Cars.com was founded in 1998 to connect used car buyers with sellers in the United States.
The firm is headed by president and CEO Alex Vetter, who has been with the firm since 1998 and was previously in business development at Classified Ventures and the Tribune Company.
The company’s primary offerings are aimed at integrating its consumer-facing website with automobile dealerships to enable customers to access advanced shopping features and value-added services, including financial services.
According to a 2022 market research report by Mordor Intelligence, the U.S. market for used automobiles was estimated at $196 billion in 2021 and is forecast to reach $302 billion by 2027.
This represents a forecast CAGR of 7.51% from 2022 to 2027.
An important driver for this expected growth is a return to normalcy after supply chain shocks due to the pandemic and other factors.
However, a rising interest rate environment has reduced automobile affordability for certain consumers, leading to variability in demand and price in recent months.
Major competitive or other industry participants include:
-
CarGurus, Inc. (CARG)
-
CarMax (KMX)
-
TrueCar (TRUE)
-
CarBravo
-
AutoNation (AN)
-
AutoTrader.com
-
KBB.com
-
Edmunds.com
-
CarsDirect.com
-
CarFinder.com.
Cars.com Recent Financial Trends
-
Total revenue by quarter has risen moderately as the chart shows below:
Total Revenue (Seeking Alpha)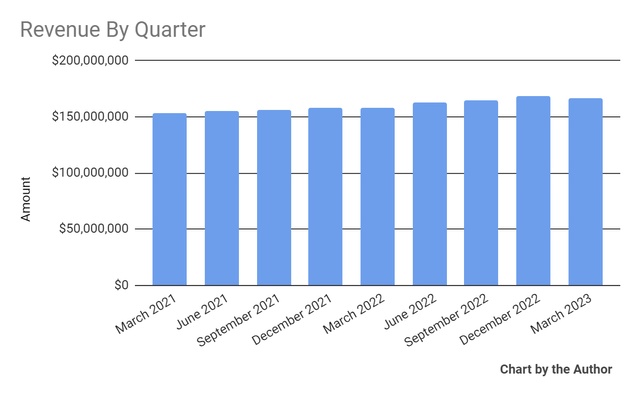
-
Gross profit margin by quarter has trended slightly lower:
Gross Profit Margin (Seeking Alpha)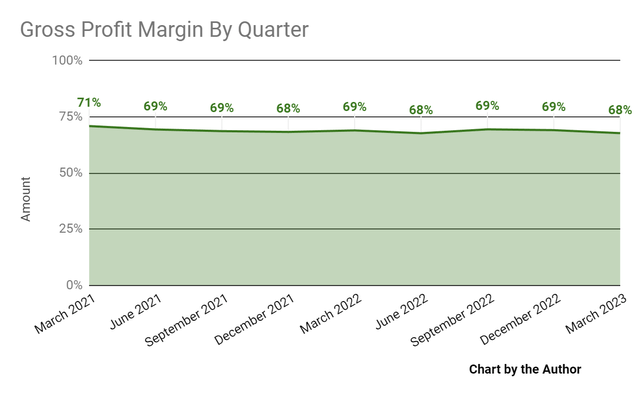
-
Selling, G&A expenses as a percentage of total revenue by quarter have dropped slightly recently:
Selling, G&A % Of Revenue (Seeking Alpha)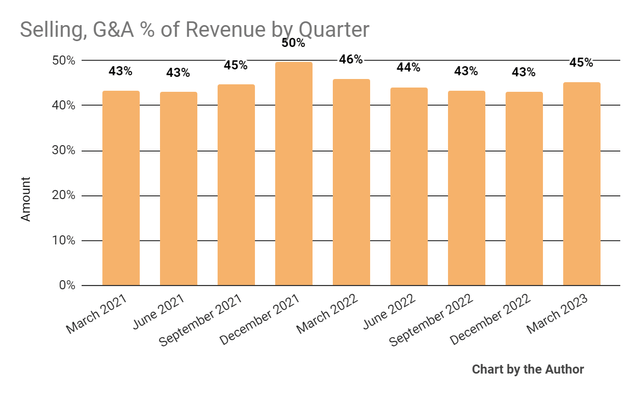
-
Operating income by quarter has been variable but trending higher:
Operating Income (Seeking Alpha)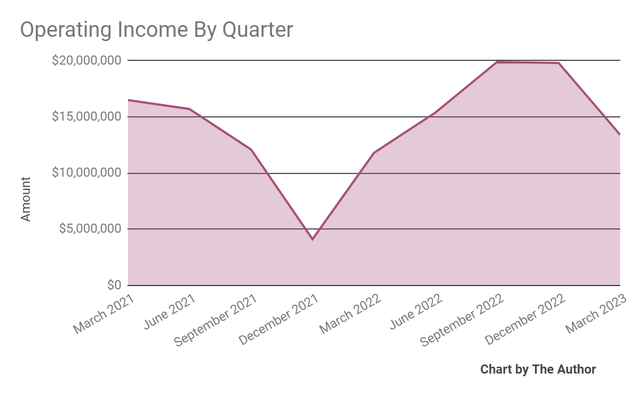
-
Earnings per share (Diluted) have risen markedly in the last two quarters:
Earnings Per Share (Seeking Alpha)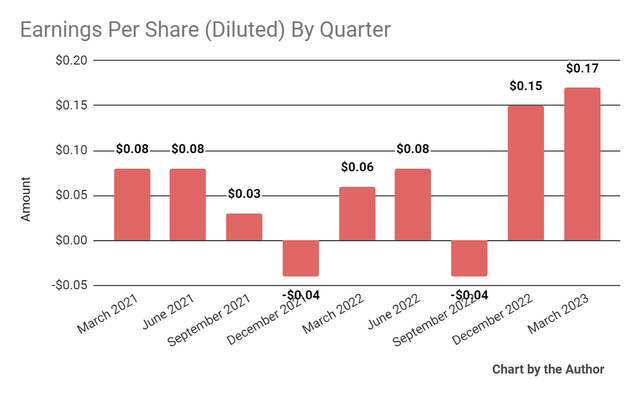
(All data in the above charts is GAAP.)
In the past 12 months, CARS’ stock price has risen 89.8% vs. that of CarGuru’s drop of 45.37%, as the chart indicates below:
52-Week Stock Price Comparison (Seeking Alpha)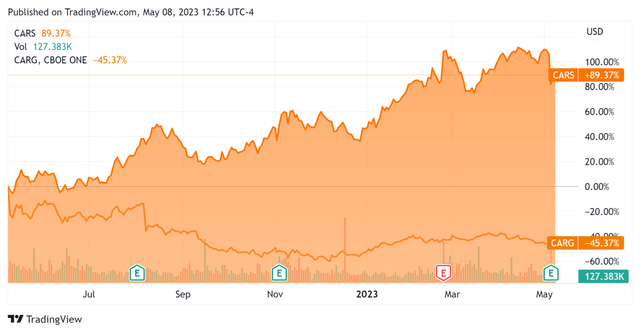
For the balance sheet, the firm ended the quarter with only $18.8 million in cash and equivalents and $454.1 million in total debt, of which $15.4 million was categorized as the current portion due within 12 months.
Over the trailing twelve months, free cash flow (“FCF”) was an impressive $106.9 million, of which capital expenditures accounted for $19.4 million. The company paid $23.1 million in stock-based compensation (“SBC”) in the last four quarters, the highest amount in the last eleven-quarter period.
Valuation And Other Metrics For Cars.com
Below is a table of relevant capitalization and valuation figures for the company:
|
Measure [TTM] |
Amount |
|
Enterprise Value / Sales |
2.4 |
|
Enterprise Value / EBITDA |
9.9 |
|
Price / Sales |
1.8 |
|
Revenue Growth Rate |
5.4% |
|
Net Income Margin |
3.7% |
|
EBITDA % |
24.6% |
|
Market Capitalization |
$1,180,000,000 |
|
Enterprise Value |
$1,610,000,000 |
|
Operating Cash Flow |
$126,290,000 |
|
Earnings Per Share (Fully Diluted) |
$0.36 |
(Source – Seeking Alpha.)
Below is an estimated DCF (Discounted Cash Flow) analysis of the firm’s projected growth and earnings:
Discounted Cash Flow Calculation (GuruFocus)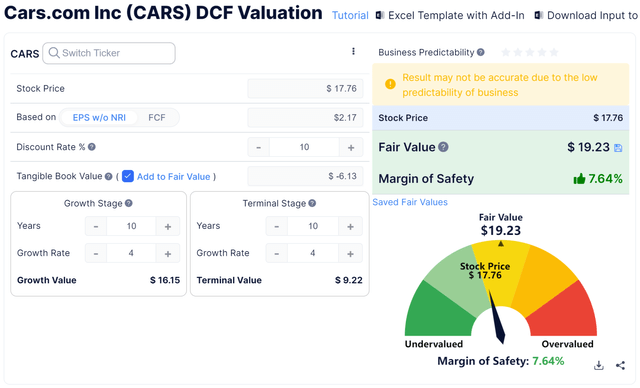
Assuming generous DCF parameters, the firm’s shares would be valued at approximately $19.23 versus the current price of $17.76, indicating they are potentially currently slightly undervalued, with the given earnings, growth, and discount rate assumptions of the DCF.
As a reference, a relevant partial public comparable would be CarGurus; shown below is a comparison of their primary valuation metrics:
|
Metric [TTM] |
CarGurus |
Cars.com |
Variance |
|
Enterprise Value / Sales |
0.9 |
2.4 |
173.0% |
|
Enterprise Value / EBITDA |
10.2 |
9.9 |
-2.8% |
|
Revenue Growth Rate |
74.0% |
5.4% |
-92.7% |
|
Net Income Margin |
11.7% |
3.7% |
-68.7% |
|
Operating Cash Flow |
$256,110,000 |
$126,290,000 |
-50.7% |
(Source – Seeking Alpha.)
Commentary On Cars.com
In its last earnings call (Source – Seeking Alpha), covering Q1 2023’s results, management highlighted the growth of average revenue per dealer [ARPD] of 4% year-over-year but continued low inventory levels and “dynamic fluctuating vehicle prices.”
The St. Louis Federal Reserve’s tracking of U.S. used auto and truck prices indicates a materially falling price index in recent months, from a high of around 215 to its current approximation of 183, a drop of nearly 15%, as shown in the chart below:
Used Auto And Truck Price Index (St. Louis Federal Reserve)
Management characterized its dealer customer churn as “some” in response to recent price increases, but indicated that once they explain the additional features coming with new option packages, the firm is “seeing good take rates.”
Total revenue for Q1 rose 5.6% year-over-year, yet gross profit margin fell by 1.2 percentage points.
SG&A as a percentage of revenue dropped 1.6 percentage points year-over-year while operating income rose 13.6%.
Looking ahead, management reaffirmed its previous full-year 2023 revenue growth expectation of 4.5% at the midpoint of the range and expects to exit Q4 2023 “with margins approaching 30%.”
The company’s financial position is a study in contrasts, with low liquidity, $454 million in debt but impressive free cash flow.
Regarding valuation, the market has rewarded Cars.com Inc.’s stock price in the past 12 months, but my discounted cash flow calculation suggests that the stock may be almost fully valued at its present level given generous valuation assumptions.
The primary risk to the company’s outlook is a macroeconomic slowdown which appears to be underway and made worse by contracting credit availability to consumers, which may reduce consumer ability to purchase used vehicles.
From management’s most recent earnings call, I prepared a chart showing the frequency of key terms mentioned (or not) in the call, as shown below:
Earnings Transcript Key Terms Frequency (Seeking Alpha)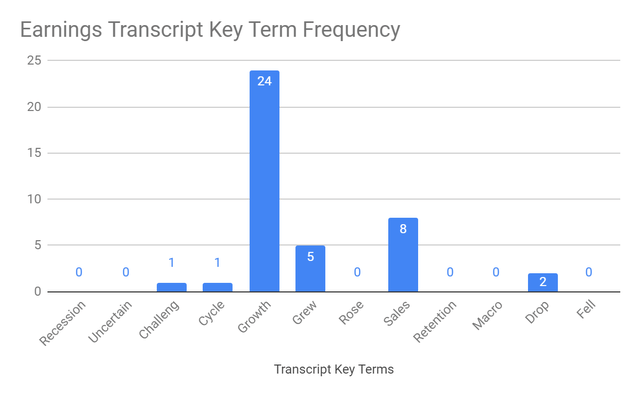
I’m most interested in the frequency of potentially negative terms, so management cited “Challeng[es][ing]” one time and “Drop” two times in various contexts.
In the past twelve months, the firm’s EV/EBITDA valuation multiple has risen by over 22%, as the chart from Seeking Alpha shows below:
EV/EBITDA Multiple History (Seeking Alpha)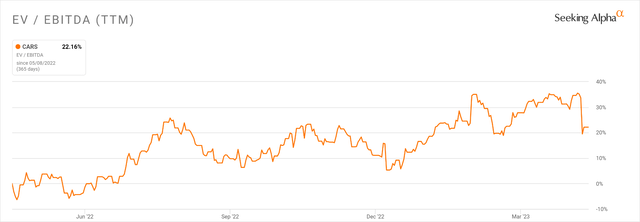
Given increasing economic slowdown risks, reduced credit availability concerns and an apparently most full valuation of CARS at its current level, I’m Neutral [Hold] on Cars.com Inc. stock in the near term.
Read the full article here


