Investment Thesis
Last week I made the first acquisition in order to start building The Dividend Income Accelerator Portfolio. The goal of this portfolio is to provide you as an investor with a reduced risk level while helping you generate extra income via Dividends and an attractive Total Return when investing over the long term.
As I explained in greater detail in my previous article, the Schwab U.S. Dividend Equity ETF (SCHD) was the first acquisition for The Dividend Income Accelerator Portfolio. I chose this ETF as the first acquisition since it helps us to achieve a broad diversification from the start. Moreover, it supports us in successfully implementing the portfolio’s investment approach, that focuses on a mix between dividend income and dividend growth.
My initial idea was to select BlackRock (BLK) as the second acquisition for The Dividend Income Accelerator Portfolio. However, after carefully analyzing SCHD, I adapted my initial plans. As BlackRock is already part of The Schwab U.S. Dividend Equity ETF (as the 15th largest position with a proportion of 3.32%), I opted for another company as my second buy.
In order to further reduce the downside risk of the portfolio from the start, I wanted my second choice to contribute to increasing portfolio diversification while reducing volatility.
In addition to that, the company should help us to raise the Weighted Average Dividend Yield [TTM] of the portfolio (which was at 3.53% after the first acquisition).
Starting with an attractive Dividend Yield from the beginning would help us benefit to a higher degree from today, while also helping us care less about our investment portfolio in case of a stock market decline within the next months.
In addition to that, the company should pay a sustainable Dividend, thus being able to raise your additional income via Dividends from year to year.
In this article, I will explain in greater detail why I’ve selected Realty Income (NYSE:O) as the second acquisition for The Dividend Income Accelerator Portfolio, and I will show you why I think it aligns perfectly with the intended investment approach.
Realty Income combines dividend income and dividend growth, has significant competitive advantages and is financially healthy. In addition to that, it can contribute to reducing portfolio volatility. Therefore, I believe it strongly aligns with the investment approach of The Dividend Income Accelerator Portfolio.
After the acquisition of Realty Income for The Dividend Income Accelerator Portfolio, it can be highlighted that with only two positions, it already provides you as an investor with at least one dividend payment each month (thanks to Realty Income’s monthly dividend payments), and an attractive Weighted Average Dividend Yield [TTM] of 3.71% while also providing you with a reduced risk level.
The Dividend Income Accelerator Portfolio
The Dividend Income Accelerator Portfolio’s objective is the generation of income via dividend payments, and to annually raise this sum. In addition to that, its goal is to attain an appealing Total Return when investing with a reduced risk level over the long-term.
The Dividend Income Accelerator Portfolio’s reduced risk level will be reached due to the portfolio’s broad diversification over sectors and industries and the inclusion of companies with a low Beta Factor.
Below you can find the characteristics of The Dividend Income Accelerator Portfolio:
- Attractive Weighted Average Dividend Yield [TTM]
- Attractive Weighted Average Dividend Growth Rate [CAGR] 5 Year
- Relatively low Volatility
- Relatively low Risk-Level
- Attractive expected reward in the form of the expected compound annual rate of return
- Diversification over asset classes
- Diversification over sectors
- Diversification over industries
- Diversification over countries
- Buy-and-Hold suitability
Realty Income’s Competitive Advantages
Realty Income was founded in 1969 and today has over 13,100 real estate properties under agreements. Since its NYSE listing in 1994, the company has paid its shareholders more than $11.6 billion in dividends and has shown a compound annual dividend growth rate of about 4.4%. Within the same time period, investors have been able to benefit from a compound average annual return of 14.2%.
Realty Income’s strong Financial Health
Different metrics underline Realty Income’s strong financial health, making the company an attractive pick to be part of The Dividend Income Accelerator Portfolio. Realty Income’s EBIT Margin stands at 40.11%, which is 93.71% above the Sector Median of 20.71%.
In addition to that, it can be highlighted that the company has an A3 credit rating from Moody’s, reflecting its strong balance sheet.
Realty Income’s Extensive Client Diversification
The graphic below illustrates Realty Income’s extensive client diversification. The company’s largest client only accounts for 3.8% of its annualized contractual rent. This extensive client diversification helps to mitigate concentration risks for the company.
This means that a loss of a major client would have a limited effect on Realty Income’s revenue, helping us to reduce the downside risk of The Dividend Income Accelerator Portfolio.
Realty Income has a total number of 1,303 clients, which are from 85 different industries, reflecting once again the company’s extensive client diversification.
Source: https://www.realtyincome.com/sites/realty-income/files/2023-07/investor-presentation-q2-2023.pdf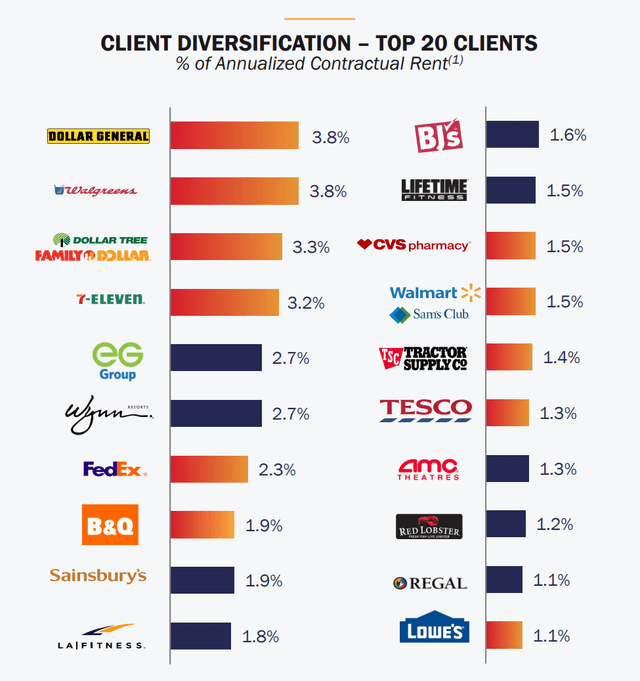
Realty Income’s extensive Industry Diversification
Realty Income has not only a broad diversification over clients, it also has an extensive industry diversification, illustrated by the graphic below. The largest annualized contractual rent comes from the Convenience Stores Industry (11.1%), followed by the Grocery Stores Industry (9.9%), and the Dollar Stores Industry (7.1%).
Since no Industry accounts for more than 11.1% of Realty Income’s annualized contractual rent, the company’s broad diversification over Industries is proven.
Source: https://www.realtyincome.com/sites/realty-income/files/2023-07/investor-presentation-q2-2023.pdf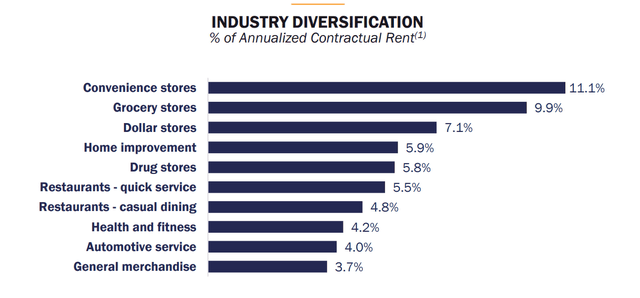
Realty Income’s Economies of Scale
Due to Realty Income’s large and well-diversified product portfolio, it can achieve cost efficiency, particularly when compared to smaller competitors. This provides the company with an additional competitive edge over its (smaller) opponents.
Realty Income’s Valuation
In the following, I will look at different Valuation metrics for Reality Income:
P / FFO [FWD] Ratio
The P / FFO [FWD] Ratio is calculated by dividing the current Market Price to Funds From Operations. It is considered to be an important metric to evaluate REITs. Reality Income’s P / FFO [FWD] Ratio of 13.64 currently stands only slightly above the Sector Median of 12.62, thus indicating that the company is fairly valued.
P / AFFO [FWD] Ratio
The P / AFFO [FWD] Ratio is calculated by dividing the Price to Adjusted Funds From Operations. Realty Income’s current P / AFFO [FWD] Ratio stands at 14.08, being 3.06% below the Sector Median of 14.53. This serves as an indicator that the company is undervalued at this moment in time.
Dividend Yield [FWD]
Realty Income’s Dividend Yield [FWD] currently stands at 5.46%, lying 13.09% above the Sector Median of 4.82%. This metric demonstrates that Realty Income is currently undervalued.
Price / Book [TTM] Ratio
Realty Income’s Price / Book [TTM] Ratio of 1.28 is below the Sector Median of 1.49, once again indicating that Realty Income is undervalued.
In summary, it can be highlighted that all of the Valuation metrics indicate that Realty Income is currently at least fairly valued, strengthening my opinion to rate the company as a buy.
Realty Income compared to its Peer Group
In the following, I will compare Realty Income to its peer group and will show you why I think it’s the most attractive pick among its peers.
Realty Income currently pays its shareholders a Dividend Yield [FWD] of 5.46%, which is significantly higher than the Dividend Yield [FWD] of competitors such as Kimco Realty Corporation (KIM) (Dividend Yield [FWD] of 4.87%) and Regency Centers Corporation (REG) (Dividend Yield [FWD] of 4.17%).
Even though NNN REIT (NNN) and Simon Property Group (SPG) pay a higher Dividend Yield [FWD] (5.76% and 6.61% respectively), it can be highlighted that Realty Income has shown a higher Dividend Growth Rate [CAGR] over the past 5 years than any of these competitors.
While Realty Income’s Dividend Growth Rate [CAGR] over the past 5 years stands at 3.71%, all of these competitors have shown a negative Dividend Growth Rate [CAGR] over the same time period: while Kimco Realty Corporation’s 5 Year Dividend Growth Rate [CAGR] lies at -3.72%, Regency Centers Corporation’s stands at -4.72%, NNN REIT’s is at -2.86%, and Simon Property Group’s is at -0.41%.
It is further worth mentioning, that Realty Income has shown the highest 5 Year Revenue Growth Rate [CAGR] (23.88%) when compared to its peers.
These metrics show that Realty Income is the most adequate choice among these peers when aiming to combine dividend income with dividend growth. This serves as an additional indicator to confirm that Realty Income strongly aligns with the investment approach of The Dividend Income Accelerator Portfolio.
|
O |
KIM |
REG |
NNN |
SPG |
|
|
Company Name |
Realty Income Corporation |
Kimco Realty Corporation |
Regency Centers Corporation |
NNN REIT |
Simon Property Group |
|
Sector |
Real Estate |
Real Estate |
Real Estate |
Real Estate |
Real Estate |
|
Industry |
Retail REITs |
Retail REITs |
Retail REITs |
Retail REITs |
Retail REITs |
|
Dividend Yield [FWD] |
5.46% |
4.87% |
4.17% |
5.76% |
6.61% |
|
Payout Ratio |
74.04% |
59.99% |
62.94% |
68.97% |
62.48% |
|
Dividend Growth 5 Yr [CAGR] |
3.71% |
-3.72% |
-4.72% |
-2.86% |
-0.41% |
|
Revenue 5 Year [CAGR] |
23.88% |
7.81% |
2.75% |
5.67% |
-0.63% |
|
EBIT Margin |
40.11% |
32.79% |
38.73% |
62.00% |
48.88% |
|
24M Beta |
0.61 |
1.02 |
0.97 |
0.67 |
1.13 |
Source: Seeking Alpha
Realty Income’s Dividend Yield and Dividend Growth Rate and the Projection of the company’s Yield on Cost
At this moment in time, Realty Income pays a Dividend Yield [FWD] of 5.46% to its shareholders. The company has shown a Dividend Growth Rate [CAGR] of 4.28% over the past 10 years.
The graphic below illustrates a projection of the company’s Dividend and its Yield on Cost when assuming that it would be able to increase its Dividend by 4% per year on Average over the next 30 years.
This assumption would imply that you could potentially achieve a Yield on Cost of 8.09% by 2033, 11.97% by 2043, and 17.72% by 2053.
When assuming the same Dividend Growth Rate of 4%, you could potentially receive your initial investment of $100 back in the form of dividends by 2037 (without including withholding taxes in this calculation).
Source: The Author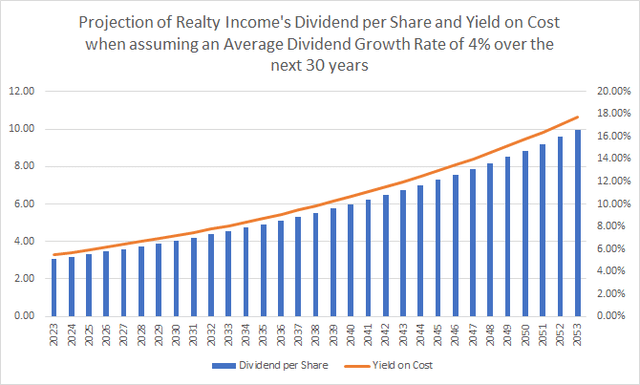
The graphic above supports my theory that you can benefit enormously from an investment in Realty Income when investing over the long term. Moreover, it provides more evidence that the company strongly matches the investment approach of The Dividend Income Accelerator Portfolio to combine dividend income with dividend growth (which we’ll discuss further in the following chapter).
Why Realty Income strongly aligns with the investment approach of The Dividend Income Accelerator Portfolio
Below you can find several factors that support my theory that Realty Income strongly aligns with the investment approach of The Dividend Income Accelerator Portfolio:
- Realty Income pays an attractive Dividend Yield [TTM] of 5.46%, which perfectly aligns with the aim of The Dividend Income Accelerator Portfolio to help you generate extra income.
- The company has shown significant Dividend Growth in the past years (its Dividend Growth Rate [CAGR] over the past 10 years stands at 4.28%), which aligns with the aim of The Dividend Income Accelerator Portfolio to raise the Dividend from year to year.
- Realty Income provides you with a mix between dividend income and dividend growth, matching another objective of The Dividend Income Accelerator Portfolio.
- It has significant competitive advantages and a strong financial health, which align with the approach of The Dividend Income Accelerator Portfolio.
- With a 24M Beta Factor of 0.61, Realty Income contributes to reducing the volatility of The Dividend Income Accelerator Portfolio and helps fulfil its objective of providing you with a reduced risk level. In case of a stock market decline within the next weeks, Realty Income would contribute to reducing the portfolio’s downside risk.
- I believe that Realty Income is an attractive risk / reward choice, which aligns with the aim of The Dividend Income Accelerator Portfolio to include companies that come attached with relatively low risk factors and can provide an attractive Total Return when investing over the long term.
- In addition to that, I believe that Realty Income is an attractive buy-and-hold investment, aligning with The Dividend Income Accelerator Portfolio being an investment portfolio for different market conditions.
Risk Factors
When compared to other REITs such as Kimco Realty Corporation, Regency Centers Corporation, NNN REIT, and Simon Property Group, it can be highlighted that Realty Income has the lowest 24M Beta Factor: while Realty Income has a 24M Beta Factor of 0.61, the 24M Beta Factors of Kimco Realty Corporation, Regency Centers Corporation, NNN REIT, and Simon Property Group are 1.02, 0.97, 0.67, and 1.13 respectively. This indicates that Realty Income is the choice with the lowest risk factors attached.
Therefore, I believe that Realty Income provides us with the highest probability among its peers of achieving an attractive Total Return. This once again aligns strongly with the investment approach of The Dividend Income Accelerator Portfolio which aims to include those companies that are attractive in terms of risk and reward.
Even though I consider the overall risk factors of an investment in Realty Income to be relatively low (which is underlined by the company’s A3 credit rating from Moody’s), there are different factors that investors should keep in mind before taking the decision to invest in the company or not.
Interest Rate Risks
Realty Income is exposed to interest rate changes. Realty Income uses different instruments in order to hedge against such risks. Nevertheless, increasing interest rates could have a significant negative impact on the company’s financial performance.
Risks related to Foreign Currency Exchange Rates
Due to the fact that Realty Income is invested in foreign markets, the company is exposed to foreign currency risks. Currency exchange rates can have a significant impact on the company’s financial performance and are therefore factors that investors need to be aware of.
Risks of a Recession
A recession could also have a meaningful impact on the company’s financial performance and is an additional risk factor that investors should take into consideration before taking the decision to invest in Realty Income or not.
Credit Risks
Another risk factor investors should have in mind are credit risks. Even though the majority of Realty Income tenants are financially relatively stable, the risk of a tenant’s default cannot be totally avoided. However, it can be highlighted that Realty Income decreases the consequences of this type of risk due to its extensive client and industry diversification.
Resuming, it can be highlighted that Realty Income mitigates most of these risk factors due to its financial health and its extensive client and industry diversification, thus helping to reduce the downside risk of The Dividend Income Accelerator Portfolio.
Investor benefits of The Dividend Income Accelerator Portfolio
I have added shares of Realty Income for the total amount of $100. This means that Realty Income currently makes up 9.09% of The Dividend Income Accelerator Portfolio while the Schwab U.S. Dividend Equity ETF currently accounts for 90.90% of the overall portfolio.
The graphic below illustrates the current positions of The Dividend Income Accelerator Portfolio.
Source: Interactive Brokers
Within the next weeks, while acquiring additional companies for The Dividend Income Accelerator Portfolio, the percentage that Realty Income and the Schwab U.S. Dividend Equity ETF hold on the overall investment portfolio will decrease. This will help us to further reduce the risk level of The Dividend Income Accelerator Portfolio.
However, it can be highlighted that after only two acquisitions, The Dividend Income Accelerator Portfolio already offers the following benefits for investors:
- A Weighted Average Dividend Yield [TTM] of 3.71%.
- The portfolio has a Weighted Average Dividend Growth Rate [CAGR] over the past 5 years of 12.99%.
- The Dividend Income Accelerator Portfolio already provides you with monthly dividend payments (Realty Income pays investors a monthly dividend).
- The portfolio provides investors with an extensive diversification over companies, sectors and industries (the Schwab U.S. Dividend Equity ETF is invested in a total of 104 companies).
- With its low 24M Beta Factor of 0.61, Realty Income serves as an important defense play in order to protect our portfolio against a stock market decline, thus reducing the downside risk for investors.
- The Dividend Income Accelerator Portfolio already serves as a buy-and-hold portfolio from which investors can benefit when investing over the long term due to its steadily increasing dividend payments.
Conclusion
Due to a mix between dividend income and dividend growth as well as the relatively low risk factors that come attached to an investment in the company, I believe Realty Income strongly aligns with the investment approach of The Dividend Income Accelerator Portfolio.
By including the company, we have managed to decrease the portfolio’s volatility (Realty Income has a 24M Beta Factor of 0.61) and risk level, and have managed to raise its Weighted Average Dividend Yield [FWD] (which now stands at 3.71%).
Through the acquisition of Realty Income, we have further ensured that from now on we will already receive at least one dividend payment each month (thanks to Realty Income paying a monthly dividend).
In case there was a stock market decline within the next months, Realty Income would serve as a defense play and contribute to protecting our investment portfolio. When starting to build an investment portfolio from scratch, I believe it is important to initially prioritize protecting the money we invest.
Even though The Dividend Income Accelerator Portfolio so far only consists of two picks (Schwab U.S. Dividend Equity ETF and Realty Income), it already provides you as an investor with a broad diversification over companies, sectors and industries, it offers an attractive Weighted Average Dividend Yield [TTM] of 3.71%, provides a reduced risk level, and monthly dividend payments. At the same time, I strongly believe that it’s attractive in terms of risk and reward (offering a reduced risk level while aiming for an attractive Total Return).
Next week, I plan to make an additional acquisition for The Dividend Income Accelerator Portfolio that aligns with its investment approach. I believe that it will help us to further raise the portfolio’s Weighted Average Dividend Yield while decreasing its risk level at the same time.
Author’s Note: Thank you for reading! I would appreciate hearing your opinion on my selection of Realty Income as the second acquisition for The Dividend Income Accelerator Portfolio. I also appreciate any thoughts about The Dividend Income Accelerator Portfolio or any suggestion of companies that would align with the portfolio’s investment approach!
Read the full article here


