0. Introduction
Preface
It’s the summer doldrums, and sales were down in July despite heavy discounting. Early indications (from the Chinese Passenger Car Association) are that August 2023 will be only modestly better than July.
The press talks of a price war, and if you’re trying to sell cars (or have shareholdings in a major player in China), then it certainly seems like the rug is being yanked out from under you. However, discounting has long been the norm for gasoline-powered vehicles (ICEs); driven by incentives, it was the new energy vehicle (NEV) market that behaved oddly. So what are seeing is the normalization of the market, as manufacturer incentives replace government incentives.
Cars after all are a durable good. As a model reaches its 3rd or 4th year of production, it faces growing competition from low-odometer used ones of the same model. As vehicles age, they also fall behind in styling, options and technology. There’s lots of variation, but a rule of thumb is that prices drop 9% per annum. Many models are only available in higher trim levels at launch, and only later can you buy a less expensive base model. That’s quiet discounting. Then comes subvented leases and car loans, and changes in dealership allocations that encourage cutting margins on older vehicles to get a better supply of “hot” sellers. Finally rebates kick in. Chinese NEVs are now facing this same pressure.
Repeat: discounting does not represent a price war, but a normalization of the market. It thus should be no surprise that discounting doesn’t lead to a sales boom.
Structure
Below I provide more detail on (1) recent market trends, drawing on my database of monthly model-level sales (Jan 2020-Jul 2023).
Three NEV producers that have been assiduously renewing their lineup have bucked this trend month after month: BYD (BYD), GAC Aion (OTCPK:GNZUF) and Li (LI). All three are also profitable. For this article, I focus on GAC (Guangzhou Auto Co) and its Aion brand of NEVs. Part (2) is on sales, part (3) on financials. I believe that GAC offers an attractive valuation from a “long” perspective, and that would improve if Aion is partially spun off with an IPO.
Then (4) there’s the economy. A variety of warning signs suggestion caution, as a slowing economy and consumer wealth lost in the real estate market may depress Chinese stocks. It could also delay an Aion IPO, and differentially affect automotive stocks if (inexperienced) Chinese investors are driven by the short term.
I append a concluding part (5).
Teaser
To give a foretaste, Aion set a new sales record in of 52,057 in August 2023 (Source Sep 1, 2023: Gasgoo); it and Li are now capacity constrained. That’s a nice problem to have, as full capacity utilization is great for profitability. It does however limit near-term growth.
Aion and Li monthly sales (Author’s database)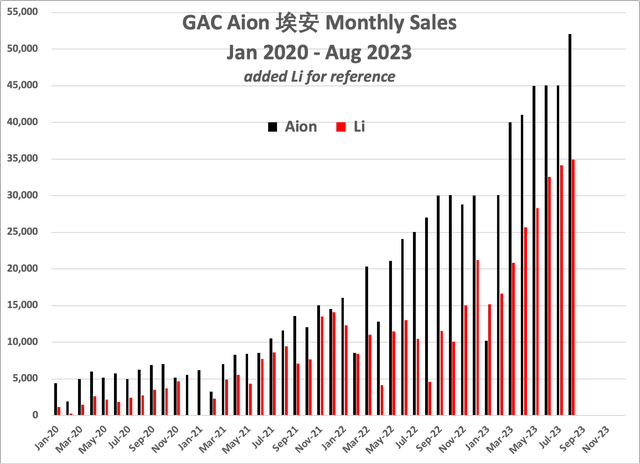
Notes and disclaimers
First, my brokerage account won’t let me purchase ADRs that don’t provide quarterly statements to the SEC. As an economist I’m trained to look at what people do, and not what they say. Without having a position, I cannot credibly rate GAC a “buy”.
Second, I use my own database to track passenger vehicle sales in China. It now includes monthly sales of 822 different models, of which 571 had positive sales in July 2023. These data are culled data from 3 different sources, for cross-checking (one or another will have occasional missing values or obvious typos). My data don’t include imports, which comprise about 3.5% of the market. I have monthly data for the top 10 importer brands, but not for model-level sales. Almost all imports are of luxury vehicles: in order the top brands are Lexus (Toyota), Mercedes, BMW, Audi and Porsche. Except for Porsche, imports are down, in part because of increased local production. My model-level data also don’t include exports, which are important for SAIC, Chery and Tesla but not for GAC. Note that because I don’t have data on imports, the 571 models in July 2023 represent an undercount. Consumer have a lot of choices relative to the options I have in the US, with some 350 ICE-only models, 160 EVs, 57 PHEVs and a few others where the data don’t allow a clean separation of sales by drivetrain.
Third, my database doesn’t include commercial vehicles. In China, however, there’s no segment comparable to full-sized pickups in the US, for which there are large sales to both households and commercial fleets. So there is a cleaner break between the commercial market and the passenger market (as is also the case in Europe). Only a few passenger vehicle firms, such as Great Wall (OTCPK:GWLLF), are major players in the commercial vehicle market. So in terms of both market dynamics and firm performance, my focus on passenger vehicle trends is sensible for looking at the major NEV players.
For convenience I use and exchange rate of 元7 / US$1 when I make conversions from RMB. At present the US$ is stronger, with a market rate at pixel of 元7.26/$.
1. The Chinese Automotive Market: 2023Q2 Update
Overview
Data through 2023Q2 present a mixed picture, with the last 12 months showing a market strong by historic standards but now slowing. Normally summer is a quiet sales month. That was not true last year, and, the rolling 3 month average shows that pattern continued this year. However, July sales were down from June, and the inventory index jumped from 1.35 to 1.70, well above the 1.5 “too high” level. That’s despite the selldown of excess non-NEV inventories. So NEV inventories are elevated. As stated above initial indications (a couple sales days remain) are that August will be about the same as July, perhaps down overall with a slight increase for NEVs. So will the fall be good? See Part 3 on the macroeconomic context.
(Note: click on the graphs to expand.)
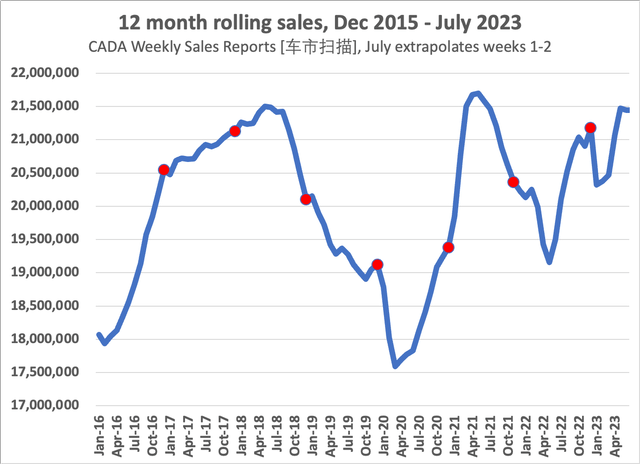 Rolling 12 m average passenger vehicle sales (Author’s database) |
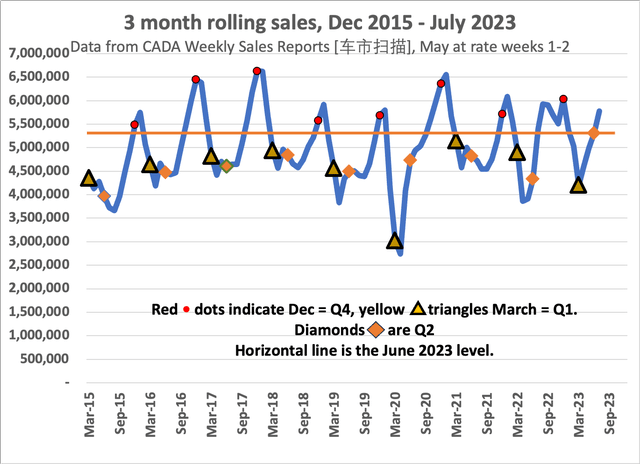 Rolling 3 m average passenger vehicle sales (Author’s database) |
Within this, the NEV market likewise has slowed. In particular, EVs have not risen above their November 2022 share of the market; the small share increase is entirely due to PHEVs. That’s true for total units, too. December 2022 saw sales of 642,952 units of EVs; July 2023 was down from June at 634,236 units. The rapid expansion of the NEV market is over. Going forward, any increase by one model or firm will come at the expense of competitors.
It’s a dog eat dog world, and that normalization means a steady compression over time of margins at the model level. EVs no longer have pricing power.
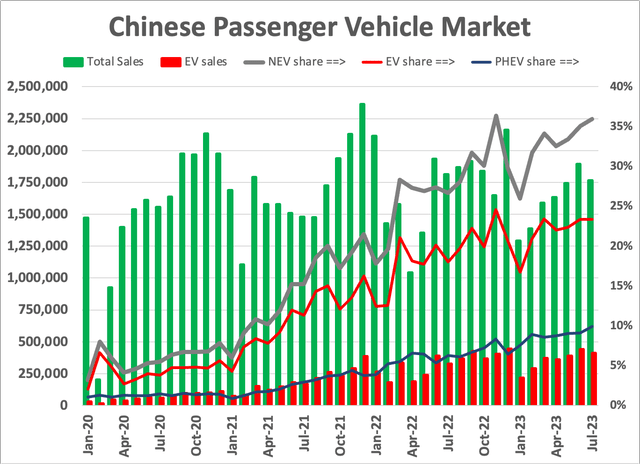 Chinese EV sales and overall car sales (Author’s database) |
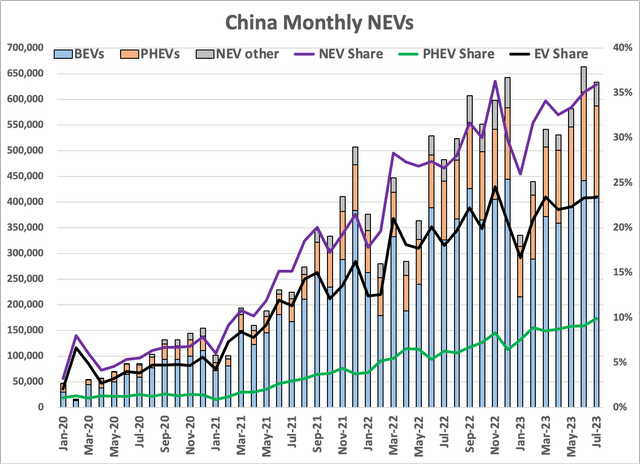 Monthly NEV sales breakdown (Author’s database) |
Additional Details
First, segments are evolving similar to the US and Europe, where the use of footprint-based emissions rules works against smaller vehicles. The GERPISA auto conference in Brussels in June included a panel discussion of lobbiests; the German luxury marques dominate the EU rule-setting process, as do light truck makers in Washington. Consumers and the environment suffer as a consequence. Lobbying in China is even more opaque than that in the US or the EU, but the bottom line is the same: small, environmentally sensible vehicles – and the firms that make them – lose out.
That shows in the evolution of shares in China. Small commuter cars – the A00 segment of the Hongguang Mini EV – peaked at 5.8% of the market in 2022Q2. A00’s were at 2.9% in 2023Q2. The A0 subcompact segment of sedans and SUVs peaked at 11.6% in 2021Q2; in 2023Q2, A0’s comprised only 7.5%. While not as extreme as in the US or Europe, that equates to larger, heavier and more expensive vehicles – and bigger and more expensive battery packs for EVs.
I now have a source of geographic and fleet data. A couple quick insights. First, the A00 segment is only 5% of the market in the Tier I metropolises (and 0% in Shanghai, where local car companies successfully lobbied to made it virtually impossible to register the ideal city car). In contrast, A00’s are 38% of the market in towns and villages. At the opposite end, Tesla (TSLA) and NIO (NIO) had zero sales in rural areas. In several large markets, the NEV share is at or nearing a peak. NEVs were 20% the Shenzhen market in July 2020, 32% in July 2021, and 46% in July 2022. In 2023 the share only hit 49% and was down from over 50% in April-June. Over the past year NEVs have risen from 36% to 43% in the six Tier I cities, 26% to 36% in the 15 or so Tier II cities, 24% to 34% in the 50 or so Tier III cities, 21% to 31% in the 100 or so Tier IV cities, and 29% to 28% in towns and villages.
However, most of the recent increase is in PHEVs, not EVs. The expansion is thus in poorer and smaller cities, which works against firms such as NIO and Tesla. In contrast, BYD (BYD) has about two-thirds of the rural market for NEVs (it and SAIC GM Wuling each have about one-third of the rural EV market).
Finally, about 18% of the NEV market is for taxis, reflecting government pressure. That market is now saturated, so future fleet sales will be limited to replacement demand. Still, three-quarters of the NEV market is for personal vehicles, but the share of EVs is falling and PHEVs rising. Sales for fleets and taxis, heavily influenced by local government, are 28% of the EV market, but only 14% of the PHEV market. Again, the future expansion of EVs, if any, will be among households.
2. GAC and its Aion EV Brand: Sales
Overview
You can readily find pixels galore on BYD, Tesla and Li (LI). Here I thus choose to focus on the #3 player in China’s EV market, GAC (OTCPK:GNZUF) and its Aion brand. Strong EV sales (100% capacity utilization, plus a public statement by Aion’s top manager, cited below) mean that as a stand-alone unit Aion is profitable. The rest of GAC is neutral, or presents problems. The best-selling model of its “house” brand, the Trumpchi M8, only managed 48,000 units over Jan-Aug this year, or 6,000 a month. GAC is profitable, but those profits come from Aion and its two remaining joint ventures, one with Honda (which also has a joint venture with Dongfeng in Wuhan) and Toyota (which also has a JV with FAW in Tianjin).
However, until recently GAC also had joint ventures with Mitsubishi Motors (200K capacity) and Jeep/Fiat (308K capacity). The Jeep JV has now been wound down / written off; the MMC JV is shuttered, and is now being wound down. In 2023H1 investments in joint ventures were thus written down by 元5.2 billion or US$750 mil. It also has the remnants of a 2018 JV with NIO in its Hycan brand, but GAC now owns 95% and sales were always low, as in 2021 NIO decided to move away from the development of lower-priced models.
Finally, GAC has a motorcycle JV with Honda (Wuyang-Honda, 1,250K capacity, $872 mil revenue and $22 mil in dividends in CY2022), and a finance subsidiary ($26 mil in CY2022 dividends). So of 5 recent JVs, 3 are down for the count, and the motorcycle and finance subsidiaries one is too small to drive overall profitability.
Now GAC is controlled by the municipality of Guangzhou, and was long hampered by the lack of coordination among the 6 government bureaus with jurisdiction over one or another aspect of its operations. (Source: Eric Thun 2006, Chapter 5 in Changing Lanes in China.) In the long run, that provided a measure of autonomy for management, who could play off one against the other; that balance improved with the transition to a joint-stock company in 2012, and subsequent stock market listing. On the downside, that history saddled it with several unsuccessful JVs, and weak performance of its legacy “house” brand. However, the thriving Aion EV brand suggest that its management is now entrepreneurial and successful in developing and implementing strategy.
So that leaves the questions of how are its legacy brand and 2 continuing JVs are doing, before turning to Aion. I follow that with an overview of its financials. GAC only releases full results on a semiannual basis, which hampers analysis given the quarterly cadence for most global firms. However, 2023H1 results were released this week.
Overall Sales Summary
| 2022Q1 | 2022Q2 | 2022Q3 | 2022Q4 | 2023Q1 | 2023Q2 | July 2023 | |
| GAC Trumpqi | 86,702 | 72,333 | 86,797 | 85,723 | 73,599 | 90,083 | 25,765 |
| GAC Aion | 44,874 | 57,978 | 82,070 | 88,835 | 80,308 | 131,028 | 45,025 |
| GAC Toyota | 173,837 | 172,643 | 190,350 | 199,161 | 148,268 | 178,903 | 53,730 |
| GAC Honda | 189,788 | 166,796 | 197,944 | 171,747 | 117,959 | 176,817 | 40,826 |
| Total | 495,201 | 469,750 | 557,161 | 545,466 | 420,134 | 576,831 | 165,346 |
Source: Author’s database.
GAC’s Trumpqi (传祺) Brand
For the sale of completeness here are sales of the “house” GAC brand. While Q2 showed some improvement, CY2022 sales of 332,000 units were only 2% above CY2021 and 13% above CY2020. Only one model currently consistently sells above 5,000 units a month. There is no indication that the brand is gaining traction; most sales appear to be in Guangdong and adjacent provinces. If these were luxury cars, volume might not be a concern, and the best seller, the M8, is the most expensive. The base prices is 元180,000 or US$26,000 though a scan of Chinese automotive sites suggests the more popular trim levels are US$10,000 more. Overall volumes and average sales prices, though, suggest that the brand loses money; see the discussion of financials. Sales are expanding, so it does not detract from an investment case in GNZUF. While it now has two NEV models, sales and profits continue to rely upon ICE models, so neither does it create a forward-looking investment case.
| Model | 2022Q1 | 2022Q2 | 2022Q3 | 2022Q4 | 2023Q1 | 2023Q2 | Jul-23 |
| 传祺E9 (PHEV) | 4,338 | 2,461 | |||||
| 传祺GS4 PLUS (EV) | 319 | 1,198 | 3,561 | 1,208 | 1,192 | 2,799 | 450 |
| 传祺M8 | 11,417 | 17,544 | 16,441 | 19,765 | 19,282 | 21,531 | 7,462 |
| 传祺GS3 | 7,908 | 5,873 | 5,520 | 3,527 | 9,636 | 15,207 | 3,959 |
| 传祺M6 | 11,623 | 5,827 | 11,025 | 9,018 | 11,740 | 14,151 | 4,763 |
| 影豹 | 9,460 | 13,946 | 11,019 | 11,315 | 6,731 | 11,633 | 3,728 |
| 影酷 | 0 | 0 | 4,310 | 12,559 | 8,602 | 9,471 | 2,682 |
| 传祺GS8 | 10,858 | 14,949 | 16,100 | 12,057 | 7,312 | 9,438 | 1,862 |
| 传祺GS4 | 33,452 | 12,112 | 17,896 | 15,712 | 8,812 | 5,805 | 853 |
| Total | 86,702 | 72,333 | 86,797 | 85,723 | 73,599 | 90,083 | 25,765 |
Source: Author’s database. For simplicity I deleted the GA8 and others with sales under 100 units in July.
Joint Ventures: Honda and Toyota
Japanese brands may be down from peak, but Q1 has been slow the past 3 years. Toyota’s GAC RAV4 (in China, the Wildlander 威兰达) sold 11,400 in July, and the Corolla Cross (in China, the Frontlander 锋兰达) sold 14,473. However, FAW also makes a RAV4 version, and combined sales of 83,000 would put it 5th in China. The Camry and Corolla are also huge sellers but are exclusive to FAW. Honda’s JV with GAC is bigger than that with Dongfeng. Both JVs produce the CR-V and the Civic, for respective sales of 79,267 and 64,250 in 2023Q2. Dongfeng produced 76,755 of those, GAC 66,762. Add in the Accord, made only by GAC, and it is the larger of the JVs. Here are a set of charts to help see what’s going on, first on GAC’s JVs, and then (separately) on Toyota’s and Honda’s JVs, plus the overall sales of Toyota and Honda.
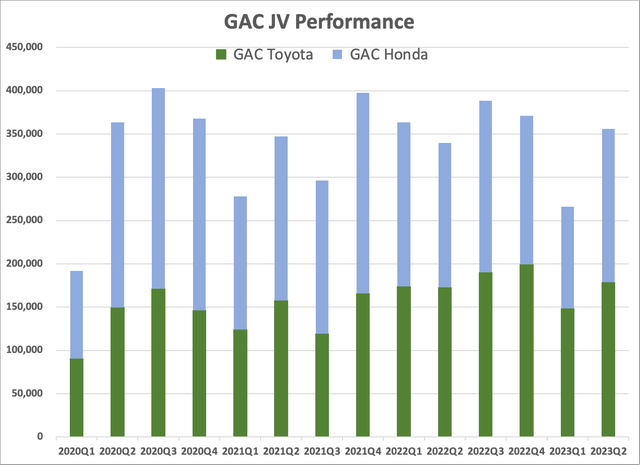 GAC Joint Venture Sales (Author’s database) |
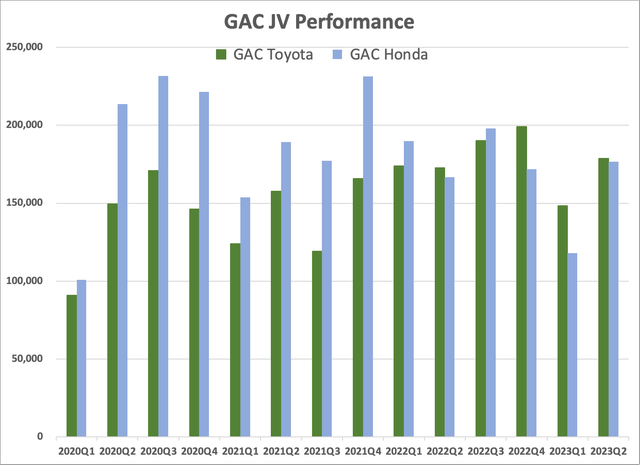 GAC Joint Venture Sales, Honda & Toyota (Author’s database) |
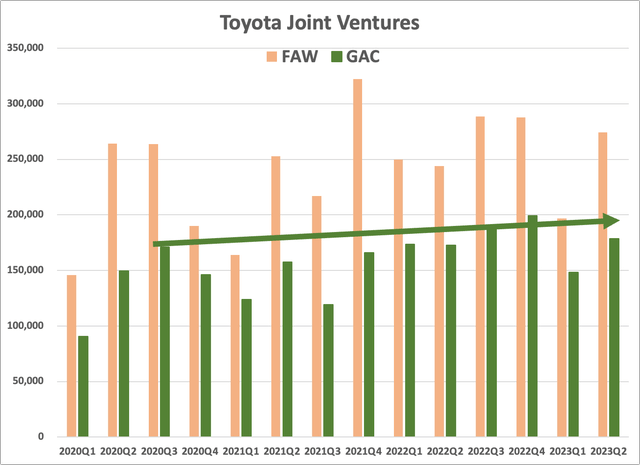 Toyota Joint Ventures, FAW and GAC (Author’s database) |
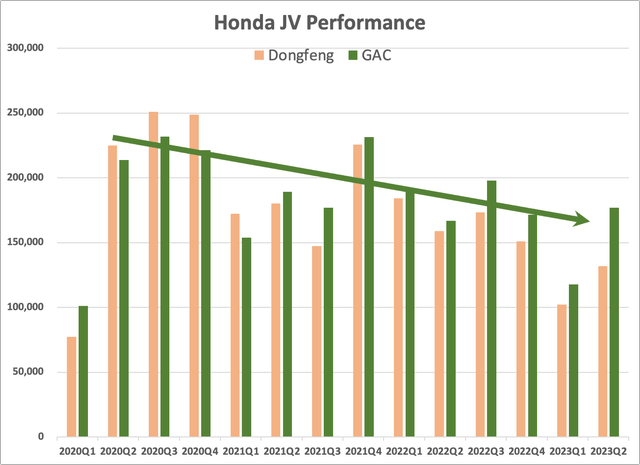 Honda’s Joint Ventures: GAC and Dongfeng (Author’s database) |
|
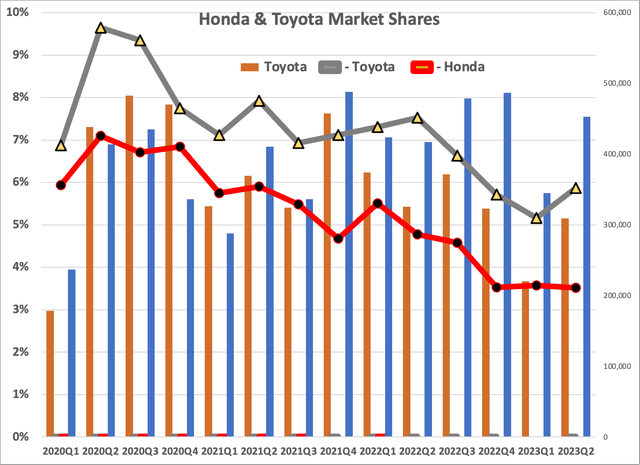
So the picture is mixed. Toyota’s share is down from the start of the Covid pandemic, but absolute numbers have kept up and production at its smaller JV with GAC is slightly higher. Honda is not doing as well, but its success is better with models produced with GAC. Both remain strong players, and continue to generate sufficient profits for GAC to offset the operating losses on its legacy house brand.
These are important for overall profitability. At 元7/US$ GAC Toyota generated US$23.4 bil in revenue and US1.1 bil in dividends in CY2022, with an end-2022 capacity of 1.0 mil units. With sales over the past 4 quarters of 720K units, that’s only 72% capacity utilization, and Toyota recently announced that 1,000 contract workers at its JV would not be rehired. GAC Honda generated US$0.6 bil in dividends, with an end-2022 capacity of 770K units and (4 quarter sales of 665K units) and 86% utilization. The continued profitability of these 2 JVs, and their ability over time to increase the weight of NEVs in their sales mix, will be important to GAC. To that end, Honda is expanding its NEV capacity to 120K units a year; Toyota has already completed an expansion of NEV capacity to 200K units a year. (Source: GAC annual reports)
Aion
The rising star at GAC is its Aion brand of EVs. It has 2 core models, the Aion S and the Aion Y, and a recently refreshed Aion V is now selling in volume. Aion has also just launched the Hyper (昊铂) GT as the first product of the Haobo “Hyper” subbrand, with initial sales of 108 in June and 2,003 in July. It’s list price starts at 元220,000, which is higher than the top trip level of the top-selling Aion S. At over US$30,000 – premium trim levels run up to US$15,000 more – it’s solidly in the Chinese luxury price bracket. In other words, Aion now offers EVs from entry level to luxury, with both A (compact) and B (midsized) sedans and SUVs.
Aion Hyper GT (Aion Website)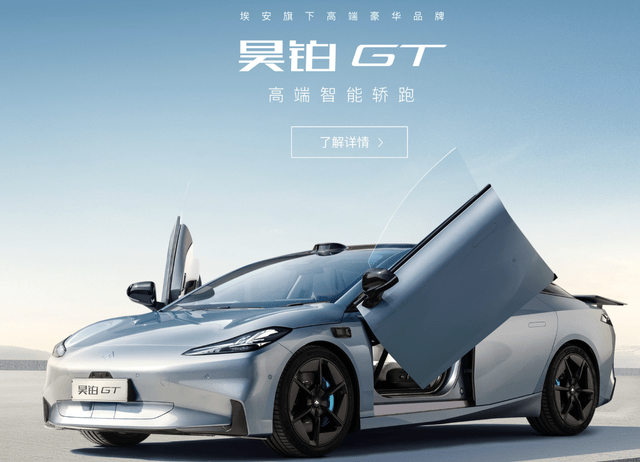
The Aion Hyper GT: 786713528562234452555236935283.jpg (3840×1800) (aion.com.cn)
| 2022Q1 | 2022Q2 | 2022Q3 | 2022Q4 | 2023Q1 | 2023Q2 | July 2023 | |
| AION S | 17,227 | 23,374 | 32,069 | 43,662 | 48,310 | 67,289 | 22,437 |
| AION Y | 18,900 | 26,249 | 36,950 | 38,486 | 31,055 | 60,954 | 17,861 |
| AION V | 7,949 | 7,219 | 11,539 | 6,142 | 913 | 2,565 | 2,679 |
| AION LX | 798 | 1,136 | 1,512 | 545 | 30 | 112 | 45 |
| Hyper GT | 0 | 0 | 0 | 0 | 0 | 108 | 2,003 |
| Total | 44,874 | 57,978 | 82,070 | 88,835 | 80,308 | 131,028 | 45,025 |
Source: Author’s database.
With two strong sellers, one new model and one refresh Aion should continue to perform strongly. In July it was second only to BYD in EV volumes, well ahead of the now-profitable Li. (Source: Aug 2 interview with Gu Huinan, Sr Mgr on Gasgoo. He noted that it took Tesla 17 years to turn a profit, Li 8 years but they reached that milestone in only 6.) August 2023 sales (model-level details not yet available) set a new record of 52,000 units, but that is above current monthly production of 45K units, so is not sustainable.
GAC does not yet break out profits for its Aion brand. However, senior management has indicated that it is already set up as a separate company and intends to spin off Aion in an IPO. No date has been specified; my supposition is that will be done once it can demonstrate full-year profitability, so will be in the second half of 2024.
3. GAC: Financials
Financials
GAC reports on a semiannual basis; 2023H1 (June) financials were released this week. So how does GAC look?
|
Jun-23 |
Mar-23 |
Dec-22 |
Sep-22 |
Jun-22 |
|
|
Total Revenues |
4,872.6 |
3,867.0 |
4,297.4 |
4,452.5 |
3,794.1 |
|
Gross Profit |
300.0 |
177.9 |
389.7 |
299.8 |
241.1 |
|
Total Operating Expenses |
528.1 |
412.8 |
545.3 |
404.4 |
456.1 |
|
Operating Income |
-228.1 |
-234.9 |
-155.6 |
-104.6 |
-215 |
|
Interest & Investment Income |
371.0 |
453.3 |
328.9 |
544.7 |
648.8 |
|
Earnings From Continuing Operations |
181.8 |
190.2 |
-6.9 |
313.5 |
420.9 |
|
Minority Interest |
15.1 |
33.7 |
7.8 |
11.4 |
-11.7 |
|
Net Income |
196.9 |
223.9 |
0.9 |
324.9 |
409.2 |
|
Total Cash & ST Investments |
7,521.4 |
5,646.6 |
6,868.4 |
5,350.7 |
4,223.1 |
|
Accounts Receivable |
1,826.7 |
1,294.9 |
1,801.7 |
1,087.6 |
1,793.1 |
|
Total Current Assets |
13,975.3 |
13,035.1 |
13,309.0 |
10,463.7 |
9,440.1 |
|
Accounts Payable |
3,078.4 |
3,261.4 |
2,589.3 |
2,593.9 |
2,105.1 |
|
Total Current Liabilities |
8,782.6 |
8,734.7 |
8,203.0 |
8,448.5 |
6,840.1 |
|
Short-term Borrowings |
1,592.9 |
1,180.9 |
960.6 |
1,232.3 |
515.9 |
|
Long-term Debt |
1,231.0 |
996.8 |
776.0 |
594.7 |
567.3 |
|
Cash Flow from Operations |
105.4 |
-107.5 |
-484.8 |
-478.6 |
-329.5 |
Source: SeekingAlpha financial data tabs for GNZUF.
Now to interpret the data.
First, stable GAC Trumpqi sharply higher Aion sales led to an increase in revenue. Given capacity constraints at Aion, and the normalization of NEV prices, there is only modest upside. At the same time, net profits have declined from 4.9% of revenue to 4.0%, though the operating loss has been trimmed from -6.1% to -4.7% of revenue. Since Aion is profitable, the overall operating loss the loss on the Trumpqi brand must be larger than the reported operating loss. Profits from the Toyota and Honda joint ventures are critical to showing a net profit. GAC does pay a dividend, with a 6% yield.
Going forward, there should be improvement as remaining operations of the Mitsubishi joint venture are wound down. Lower lithium prices should offset modest discounts of Aion models, while good Aion capacity utilization reduces the pressure to fully match the discounts of some other NEV producers, such as Tesla.
4. Macroeconomic Trends: Downside Risks Remain
I could append a list of stories from the last week, appearing in all major English-language publications, including the Economist, BusinessWeek, FT, WSJ, NYT and WaPo.
In the background is the lack of robust healthcare and pension provisions for most Chinese; that drives high levels of personal savings. Overall growth is thus inordinately dependent in international comparison on investment, particularly horizontal (infrastructure) and vertical (housing/commercial) construction.
A second element is longstanding financial repression, with bank accounts paying yields that over the past 25 years have been below real growth and often below inflation. The has driven disintermediation, with household purchases of real estate and investment trusts offered in the shadow finance market. The typical pattern has been for households to take out a mortgage to purchase a condominium before construction starts, including a large down payment. Upon completion – currently problematic as seen with the collapse of Evergrande and now Country Gardens – these condominiums still have bare walls with wires and pipes sticking out, and so are not ready for occupancy. While some of the purchasers will finish and occupy their units, tens of millions represent speculative investments. Ditto investment trusts, a large share of which represent loans to LGFVs (local government financial vehicles). But LGFVs are themselves dependent on real estates sales, as local governments in China have meager taxing authority, and so depend upon the sale of land to developers.
At some point the central government will need to take over LGFV debt, directly or through the formal banking system. Excess real estate inventory will need to be worked off, which will be hard for the Tier II and particularly Tier III cities in which the population is falling. All of this is in the context of a falling working age population (in decline since 2014) and now an overall population decline. On net migration to cities has ceased, so the continuing growth of Shanghai and a handful of other urban areas comes at the expense of smaller cities. Meanwhile the national highway network is new and extensive, there are a large number of new regional airports, and a new national high-speed rail network. Government stimulus may again turn to construction, but with a large installed base, this will not produce an improvement in productivity.
First and foremost, going forward that means permanently slower growth. It does not mean meltdown, but after 40 years as an economist following the US, Japanese and Chinese economies, policy mistakes are inevitable. Neither does it mean that household incomes will fall. Household vehicle ownership rates continue to rise, but at present higher replacement sales offset the drop in first-time purchases, with the greater availability of less expensive used vehicles supports higher ownership rates. I won’t try to project rates, but rather want to stress that there is a strong base for sales around an annual rate of 21.5 mil units. That will be true only for the next 5 years; the graph below of Japanese domestic sales should serve as a caution on the more distant future. Note though the shift towards larger and higher-priced vehicles, something also occurring in the Chinese market. Sales volumes alone exaggerate the decline.
Japanese Passenger Vehicle Sales Trends (Author’s database, JAMA data)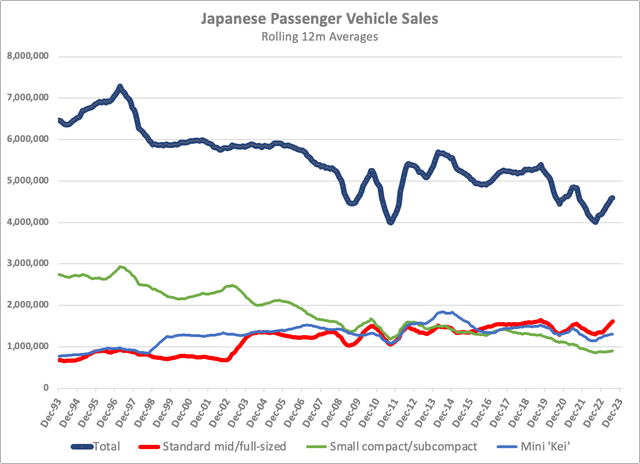
Second, that the real estate bubble is breaking need not translate into a full-blown crisis. For those wanting a balanced account, please read an article by Nick Lardy of the Peterson Institute, “How Serious is China’s Economic Slowdown?” I’ve known him for over 40 years – he was at Yale when I started on my PhD there – and is one of the two senior economists who are China specialists (the other is Dwight Perkins, emeritus at Harvard, and a reader of my undergrad senior paper, with Barry Naughton of UCSD [a grad school contemporary of mine at Yale] and Tomoo Marukawa of the University of Tokyo [who I’ve know for a couple decades] the leaders of the next generation). I drop names not for self-promotion, but to suggest that the business press is prone to fads and is focused on new information over presenting historical and analytic context.
In sum, on balance I do not expect a sharp downturn in China’s auto market this year or next, but that does remain a possibility. Nor do I expect a political crisis to disrupt overall access to the Chinese market for investors, but there are seasoned observers such as Malcolm Riddell (who blogs at China MacroReporter) who argue that what might be rational from an international perspective may not appear so to today’s Chinese leadership. After all, from a global financial perspective Russia’s invasion of the Ukraine never made sense, but it still happened.
Investing in China is not without risks, and my weighting of possibilities may not be yours.
5. Investment Case Summary
GAC bears watching, particularly if there is a market correction. However, its ADR GNZUF is thinly traded, with average levels of 10,000 shares a day and more recently around 30,000 shares. With a share price of $0.50 that’s only US$5,000-US$15,000 a day. A purchase will move the market against you, and buy/sell spreads work against short-term positions. At mid-day Aug 30 only 6,700 shares of OTCPK:GNZUF had traded, versus 23 million for Ford (F) and 100 million for Tesla (TSLA). If you have the ability to do so, it would be better to trade on the Hong Kong market (HKEX code 2238). For additional research, you can find the normal array of financial data as well as analysis (in Chinese) at SINA (新浪财经 code 601238).
The “buy” case rests primarily on an IPO for Aion, which should boost the price of GAC’s shares even if the IPO itself is overpriced. In addition, GAC has just filed for an IPO for its OnTime ridehailing subsidiary, which is currently running robotaxi fleets in Guangzhou and a handful of other large cities. As is true for others in the robotaxi market (though Waymo for example doesn’t provide financials), it currently operates deeply in the red. The IPO will serve to transfer those losses from GAC to outside investors, and in the short run will probably produce paper gains. Finally, the RMB is currently near a 15-year low against the US dollar. Over the medium term, a reversion from 元7.2-7.3 to the spring 2023 level of 元6.8-6.9 would provide another boost. Finally, Aion has commenced exports, with the first 100 vehicles en route to Thailand.
I rate GAC (OTCPK:GNZUF) as a “hold” both because I do not currently own GAC, and because I cannot make a strong case for a sharp rise in profits or revenue. At the same time, I also see only a modest risk of a drop in revenue or a further deterioration in profits. Does a P/E of 6.7 for what is increasingly an electric vehicle manufacturer make it a good buy? I have yet pull the trigger, but will likely put in a limit order for 500 shares sometime in the next month. Anything more will move the market against me, since I don’t have (and will not establish!) a trading account to buy Hong Kong “H” shares, much less an account inside China that would allow me to directly buy “A” shares.
Editor’s Note: This article discusses one or more securities that do not trade on a major U.S. exchange. Please be aware of the risks associated with these stocks.
Read the full article here