Introduction
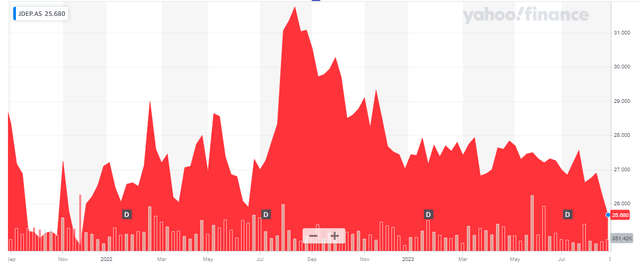
JDE Peet’s (OTCPK:JDEPF) (OTC:JDEPY) is one of the largest coffee distributors in the world (with brands like L’Or, Senseo, and Tassimo in its portfolio). As it doesn’t look like the coffee drinking contingent of the world is decreasing, I like the company’s strong position and very robust cash flows. This was once again confirmed in the first semester of this year where the underlying free cash flow (adjusted for changes in the working capital) again exceeded 500M EUR which puts the company on track to report a full-year free cash flow result of in excess of 1B EUR and about 2.05-2.15 EUR per share. And that makes JDE attractive at its current share price of less than 26 EUR per share, despite the high debt load.
Yahoo Finance
JDE Peet’s has its primary listing in Amsterdam, where it is trading with JDEP as its ticker symbol (it also means the dividends are subject to the standard 15% Dutch dividend tax withholding rate). The average daily volume is approximately 220,000 shares and that definitely makes Amsterdam the most liquid listing to trade the common shares of JDEP. I will use the Euro as base currency throughout this article, as that’s the currency of its main listing and the currency the company reports its financial results in.
The company currently has 487.5M shares outstanding, resulting in a market capitalization of 12.5B EUR.
The cash flows remain strong
In my previous article, I was mainly focusing on JDE’s strong cash flows. While the company does not appear to be very cheap based on the earnings multiple, a substantial portion of its operating expenses consists of non-cash items and that’s why the free cash flow result is much stronger than the net income. That’s useful, as JDE can use its incoming cash flow to reduce its debt pile before it has to refinance its bonds.
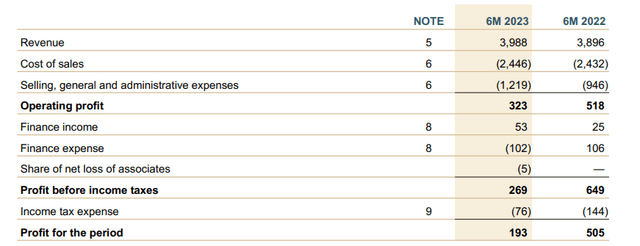
In the first half of 2023, JDE Peet’s reported a 2.4% revenue increase, but the organic revenue increase was a more impressive 3.5%. While the volumes were about 3.3% lower than in the first semester of last year, JDE was able to increase its prices by 6.8% resulting in the 3.5% total organic revenue increase.
The total reported revenue increase was 2.4%, and this resulted in a total revenue of just under 4B EUR. But while the revenue increased, the operating profit decreased by almost 40% to 323M EUR. As you can see below, the COGS remains pretty stable and the almost 29% increase in the SG&A expenses is what caused the operating profit to come in substantially below last year’s level.
JDE Peet’s Investor Relations
That increase was mainly caused by higher advertising expenses but also included a bunch of non-cash items. As you can see below, the depreciation, amortization and impairment charges almost doubled in the first half of the current financial year compared to the first semester of last year.

JDE Peet’s Investor Relations
This is a prime example of why the income statement doesn’t always paint the whole picture. This also means the net income of 197M EUR or 0.41 EUR per share should be taken with a grain of salt.
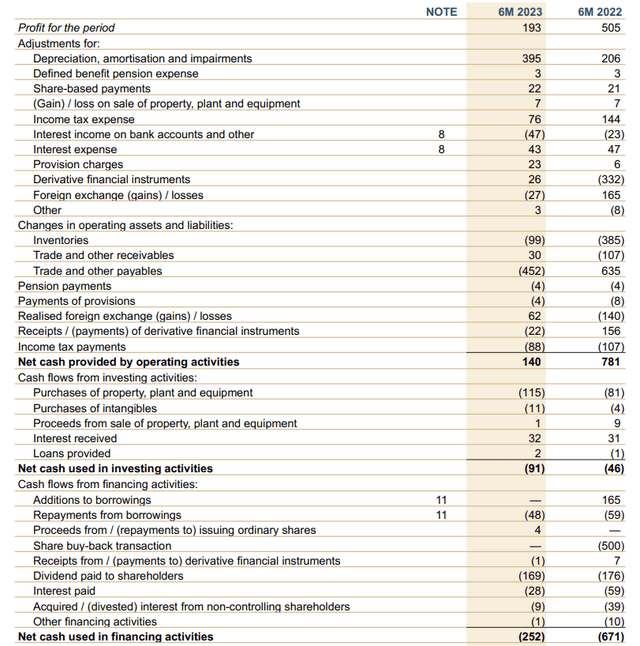
That’s why I wanted to have a closer look at the cash flow statement. The reported operating cash flow of 140M EUR wasn’t great either, but there are some adjustments that need to be made. First of all, the company made 88M EUR in cash tax payments but only owed the tax man 76M EUR. That difference of 12M EUR should be added back to the operating cash flow to get a more realistic overview of the normalized cash flows.
JDE Peet’s Investor Relations
That being said, we should deduct the 28M EUR in interest payments and 46M EUR in lease payments. On the other hand, we should add the 32M EUR in interest income to the equation. Additionally, there was a net investment of 521M EUR in the working capital position (mainly a reduction of the payables) and when all is said and done, the underlying operating cash flow in the first half of the year was approximately 631M EUR.
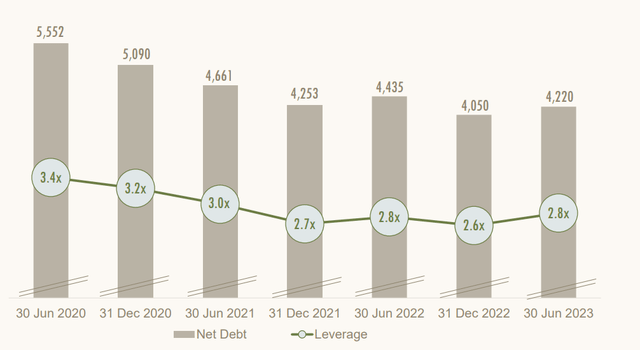
The total capex was just 126M EUR (the capex in the second semester will be roughly the same), which means the underlying free cash flow result in the first half of the year was approximately 505M EUR. That’s approximately 1.03 EUR per share. And this also means JDE Peet’s is well on track to report another year wherein its free cash flow result exceeds 1B EUR (note: the reported free cash flow will be lower due to the aforementioned changes in the working capital elements). And that cash flow will be useful to keep the net debt and the debt ratios in check.
JDE Peet’s Investor Relations
Investment thesis
I expect JDE Peet’s to report an underlying free cash flow result of in excess of 2 EUR per share, which means the free cash flow yield is currently still around 8%. The reported net income in the first semester was low due to non-cash elements, but as you know, this has no impact on the cash flow performance, which remains strong.
The debt ratio remains relatively high (2.8 as of the end of H1) and JDE mentioned share buybacks are not very high on its list of priorities as long as the leverage ratio exceeds 2.5. Meanwhile, the company remains active on the M&A front as it recently announced an acquisition in Brazil (this acquisition will only close in 2024 and will have no impact on the company’s H2 performance).
The main element JDE will have to deal with is the gradual refinancing of its (very cheap) debt. In September next year, a bond with a 0.8% coupon comes due and will have to be refinanced. But as explained in my previous article, JDE’s debt repayment schedule is spread out over about a decade and the company should be able to mitigate the impact of higher interest expenses.
I still have no position in JDE Peet’s, but the company is still on my short list. Due to the low volatility levels, the option premiums are too low to be interesting, otherwise I would have started again to write put options on JDE Peet’s.
Editor’s Note: This article discusses one or more securities that do not trade on a major U.S. exchange. Please be aware of the risks associated with these stocks.
Read the full article here


