Introduction
The Tulsa, Oklahoma-based Helmerich & Payne, Inc. (NYSE:HP) released its fiscal second quarter 2023 results on April 26, 2023.
This article is an update of my preceding article, published on January 30, 2023. I have followed HP on Seeking Alpha since September 2014.
1 – Fiscal 2Q23 Results Snapshot
Helmerich & Payne, Inc. announced a fiscal second-quarter 2023 net income of $164.04 million, or $1.55 per diluted share, compared to a loss of $4.98 per diluted share in the same quarter a year ago. This quarter, revenues were $769.22 million, up significantly from $467.60 million last year.
President and CEO John Lindsay said in the conference call:
H&P delivered another outstanding quarter and executed on several strategic objectives. On our Q2 earnings call last year, we announced a goal to achieve direct margins of 50% in our North America Solutions segment, as the pathway to generating an annualized return of our cost of capital. I’m pleased to report we have achieved that margin goal with the second fiscal quarter results.
Net cash provided by operating activities was $140.88 million for the second quarter of the fiscal year 2023 compared to $22.61 million in the prior quarter.
In March, H&P’s North America Solutions segment left the fiscal first quarter with 179 active rigs. However, the rig count will decrease next quarter to 155 and 160 contracted rigs.
Mark Smith said in the conference call:
we exited fiscal Q2 with 179 rigs working, we have since seen several April releases and as of today’s call we have 169 rigs contracted. 176 of which are super spec rigs, and we project that by the end of the third fiscal quarter, we will have between 155 and 160 contracted rigs.
Last quarter we peaked at 185 working super-spec rigs and with 18 recently idled, we are at approximately 90% utilization of the recently active fleet.
HP Rig counts Presentation (HP March Presentation)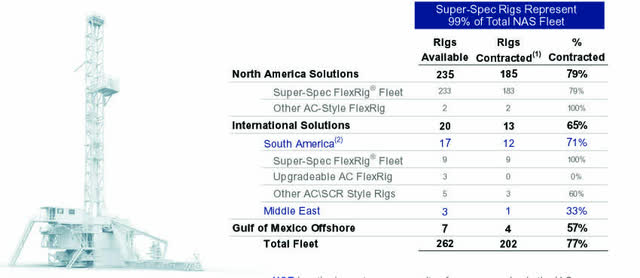
2 – Investment Thesis
Helmerich & Payne’s results were better than expected. The onshore drilling business has been solid over the past few quarters. However, oil and gas prices have dropped significantly this quarter, weakening demand.
HP 1-Year Chart oil and NG Prices (Fun Trading StockCharts)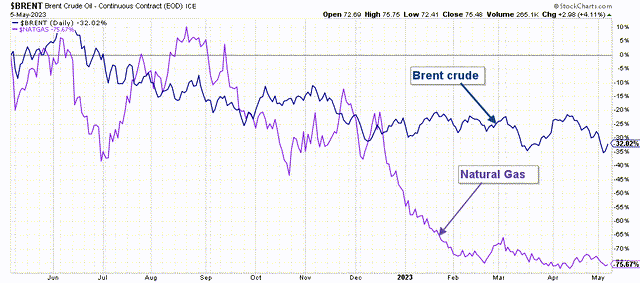
Thus, I still consider HP a good long-term investment with a sound balance sheet and excellent growth prospects. HP is tightly associated with oil and gas prices and could easily be the first stock to drop if oil prices fall due to declining demand.
HP Investment Thesis (HP Presentation)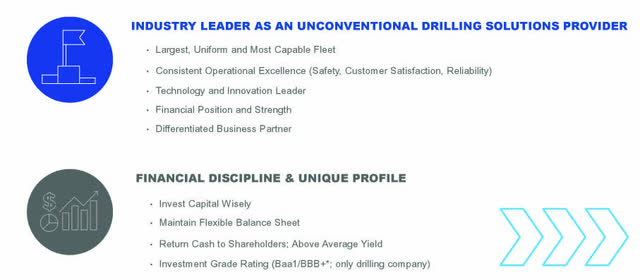
Still, we may enter some tough headwinds in this industry, which could push HP to drop even further if the risk of recession materializes in H2 2023. Hence, it is essential to accumulate the stock cautiously, expecting lower lows for a while.
Therefore, I suggest trading 50% LIFO in your entire position to protect you from a sudden drop. This dual strategy is what I am suggesting in my marketplace, “The Gold and Oil Corner.”
3 – Segment Discussion
3.1 – North America Solutions Segment
Operating income was $182.1 million, compared to $145.3 million last year. The increase in operating income reflects more of our older term contracts continuing to reprice at higher contract economics, improving the overall pricing level across the fleet.
Direct margins increased by $35.9 million to $296.2 million as revenues and expenses increased sequentially.
Quarterly operating results were impacted by the costs associated with reactivating rigs: $5.2 million in the second fiscal quarter compared to $8.6 million in the previous quarter.
3.2 – Offshore Gulf of Mexico Segment nearly unchanged sequentially
The company recorded an operating income of $6.7 million compared to an operating income of $6.7 million during the previous quarter. Direct margins for the quarter were $9.3 million compared to $9.5 million in the prior quarter.
3.3 – International Rigs Segment
This segment had an operating income of $4.0 million compared to an operating income of $1.6 million during the previous quarter.
Direct margins during the fourth fiscal quarter were $8.6 million compared to $13.8 million during the previous quarter.
4 – Stock Performance
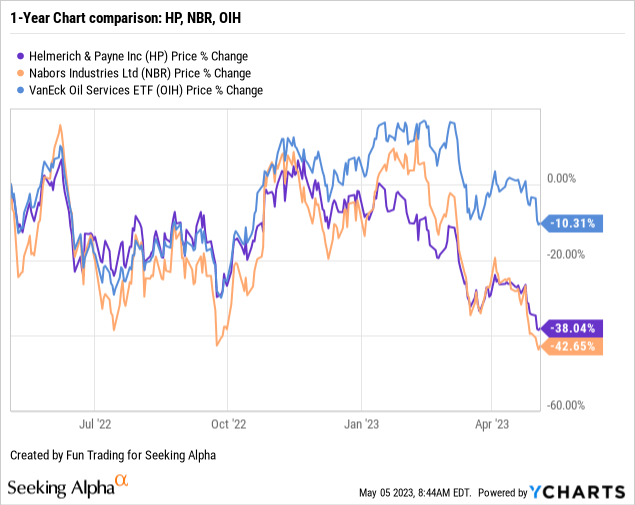
HP is down 38% on a 1-year basis, while Nabors Industries (NBR), its direct competitor, is down 43%. HP and NBR significantly underperformed the VanEck Vectors Oil Services ETF (OIH).
Helmerich & Payne – Balance Sheet: 1Q23 (Fiscal Second Quarter 2023) – The Raw Numbers
| Helmerich & Payne | 4Q21 (fiscal 1Q22) | 1Q22 (fiscal 2Q22) | 2Q22 (fiscal 3Q22) | 3Q22 (fiscal 4Q22) | 4Q22 (fiscal 1Q23) | 1Q23 (fiscal 2Q23) |
| Total Revenues in $ Million | 409.78 | 467.60 | 550.23 | 631.33 | 719.64 | 769.22 |
| Net income in $ Million | -51.36 | -4.98 | 17.75 | 45.54 | 97.15 | 164.04 |
| EBITDA in $ Million | 47.85 | 105.38 | 124.32 | 175.95 | 229.83* | 315.52 |
| EPS diluted in $/share | -0.48 | -0.05 | 0.16 | 0.42 | 0.91 | 1.55 |
| Operating cash flow in $ Million | -3.72 | 22.61 | 97.75 | 117.27 | 185.38 | 140.88 |
| CapEx in $ Million | 47.89 | 67.14 | 78.15 | 79.35 | 96.03 | 85.45 |
| Free Cash Flow in $ Million | -51.61 | -44.53 | 19.59 | 37.92 | 89.35 | 55.43 |
| Total cash in $ Million | 441.26 | 350.58 | 332.99 | 349.23 | 347.64 | 244.76 |
| Long-term debt in $ Million | 542.24 | 541.97 | 542.29 | 542.61 | 542.93 | 542.73 |
| Dividend per share in $ | 0.25 | 0.25 | 0.25 | 0.25+0.235 | 0.25+0.235 | 0.25+0.235 |
| Shares outstanding (Basic) in Million | 107.57 | 105.39 | 106.02 | 106.08 | 106.10 | 104.36 |
Data Source: Company release
Financials And Balance Sheet Snapshot
1 – Revenues Were $769.22 Million In Fiscal 2Q23
HP Quarterly Revenues History (Fun Trading) Helmerich & Payne reported $769.22 million in the fiscal second quarter of 2023, up from $467.60 million in the same quarter a year ago and up 6.9% sequentially.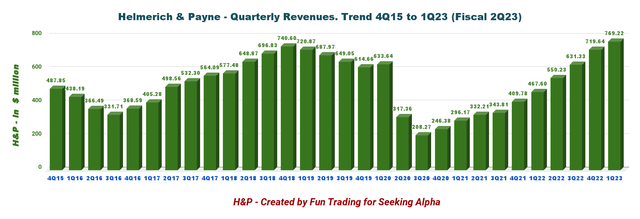
HP posted an income of $1.55 per diluted share versus a loss of $0.05 in the previous year’s quarter.
Net cash provided by operating activities was $140.88 million for the second quarter of 2023 compared to $185.38 million for the first quarter of the fiscal year 2023.
2 – Free Cash Flow was estimated at $55.43 Million in Fiscal 2Q23
HP Quarterly Free Cash Flow History (Fun Trading)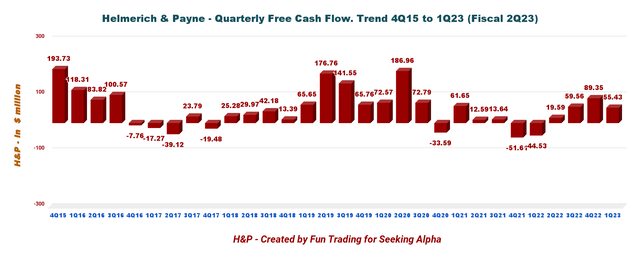
Note: Generic free cash flow is the cash from operations minus CapEx.
The company recorded a trailing 12-month FCF of $202.29 million. The free cash flow for the fiscal second quarter is estimated at $55.43 million.
On March 31, 2023, the Company’s Board of Directors declared a quarterly base cash dividend of $0.25 per share and a supplemental cash dividend of $0.235 per share.
The Company’s Board of Directors increased the maximum number of shares authorized to be repurchased in the calendar year 2023 to five million common shares representing a one million share increase from the previous year’s authorization.
3 – Net Debt was $297.97 Million In Fiscal 2Q23
HP Quarterly Cash versus Debt History (Fun Trading)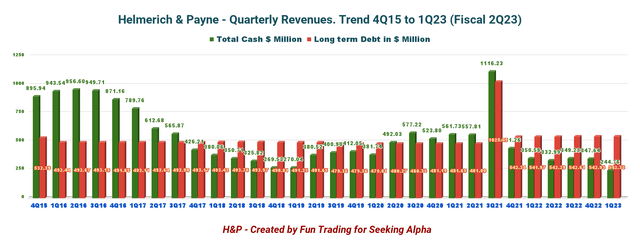
The company had $244.76 million in cash, short-term investments, and $750 million available under its committed revolver. Debt was $542.73 million in fiscal 2Q23. The company shows a net debt of $297.97 million with a debt-to-capitalization of 17%.
Total liquidity was roughly $1.1 billion on March 31, 2023. The debt is a $550 million public bond with maturity in 2031.
HP Balance Sheet Presentation (HP Presentation)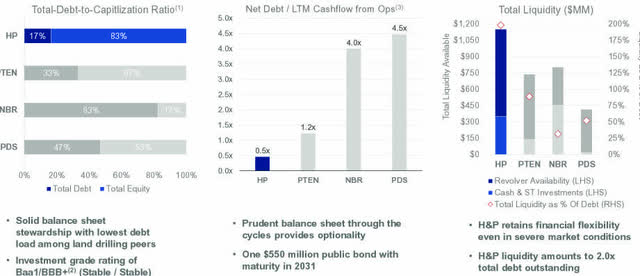
4 – Outlook for the third quarter of 2023 and CapEx for full-year 2023
North America Solutions:
HP expects North America Solutions’ direct margins to be between $280-$300 million, which includes approximately $4.0 million in estimated reactivation costs. Also, the company expects to exit the quarter between about 183-188 contracted rigs.
International Solutions:
HP expects International Solutions’ direct margins to be between $4-$7 million, excluding foreign exchange gains or losses.
Gulf of Mexico:
HP expects Offshore Gulf of Mexico direct margins to be between $5.5-$7.5 million
CapEx Guidance FY23
HP expects Gross capital expenditures to be approximately $400 to $450 million, exclusive of ongoing asset sales that include reimbursements for lost and damaged tubular and sales of other used drilling equipment that offset a portion of the gross capital expenditures and are expected to total approximately $65 million in the fiscal year 2023.
Technical Analysis And Commentary
HP TA Chart Short-Term (Fun Trading StockCharts)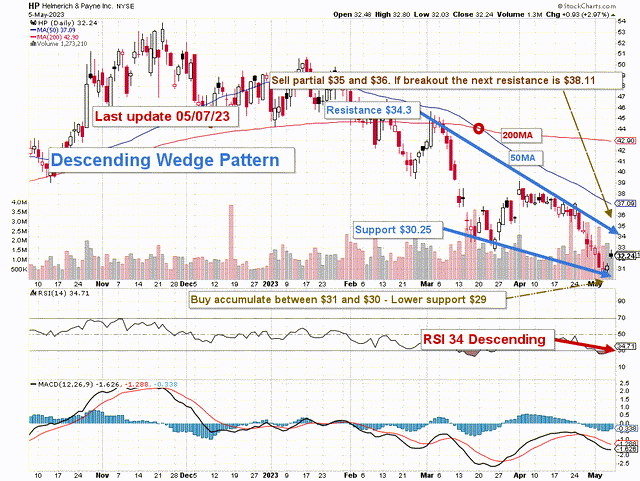
Note: The chart is adjusted for the dividend
HP forms a descending wedge pattern with resistance at $34.3 and support at $30.25. RSI is 34, which shows an oversold situation.
The falling wedge is a bullish chart pattern that signals a buying opportunity after a downward trend or mark correction.
In my preceding article, the short-term trading strategy is to trade LIFO for about 50% of your position, which I still recommend this week.
I suggest selling between $35 and $36 with possible upper resistance at $38.11 and waiting for a retracement between $31 and $30 with possible lower support at $29.
Watch oil prices like a hawk.
Warning: The TA chart must be updated frequently to be relevant. It is what I am doing in my stock tracker. The chart above has an eventual validity of about a week. Remember, the TA chart is a tool only to help you adopt the right strategy. It is not a way to foresee the future. No one and nothing can.
Read the full article here


