The Eaton Vance Limited Duration Income Fund (NYSE:EVV) is a close-end fund (“CEF”) offered by Eaton Vance that aims to generate high current income from a broad portfolio of income securities.
With long-term total returns of 1-3% p.a. versus a distribution yield of 10.1%, the EVV appears to be a yet another amortizing ‘return of principal’ fund that Eaton Vance advises investors to avoid.
Fund Overview
The Eaton Vance Limited Duration Income Fund aims to provide high current income from a broad portfolio of income producing securities. Under normal market conditions, the EVV fund will invest at least 25% of total assets in investment grade securities (which may include U.S. Treasuries and mortgage-backed securities) and at least 25% in non-investment grade securities (which may include senior loans and high yield bonds).
The EVV fund may utilize leverage to enhance returns. As of December 31, 2022, the fund had 35.4% effective leverage from preferred shares and debt (Figure 1).

Figure 1 – EVV has 35% leverage (Eaton Vance)
The EVV fund had $1.2 billion in net asset and charged a 1.77% expense ratio as of March 31, 2022 (Figure 2). Investors should note that with the rise in interest rates in 2022, the total expenses of the EVV fund probably went up as a result of increased interest expenses. However, we will only find out once the fund’s fiscal 2023 annual report is available sometime in May.
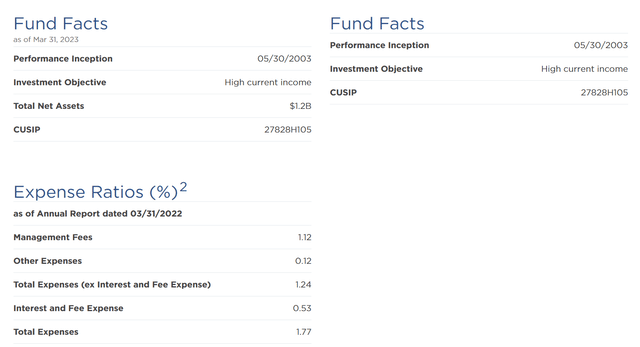
Figure 2 – EVV fund details (Eaton Vance)
Portfolio Holdings
The EVV fund’s asset class allocation as of December 31, 2022 is shown in Figure 3. The fund had 32.4% of investments in senior loans, 29.4% invested in non-investment grade (“junk”) bonds, 24.7% in agency mortgage backed securities (“MBS”), 5.2% in investment-grade bonds, and 4.6% in commercial mortgage-backed securities (“CMBS”).
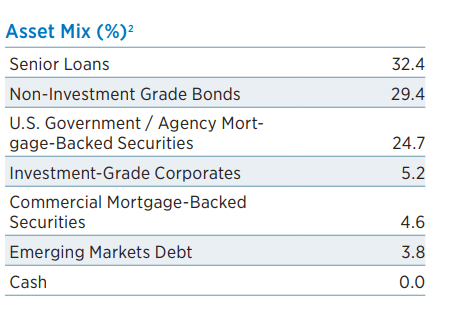
Figure 3 – EVV asset class allocation (EVV factsheet)
Figure 4 shows the fund’s credit quality allocation. 32.9% of the investments are investment grade (>BBB), with 21.8% being AAA-rated. 24.7% of investments are rated BB and 30.5% are B-rated.
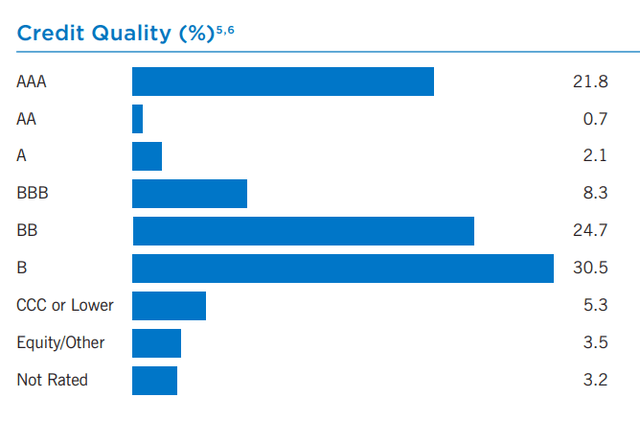
Figure 4 – EVV credit quality allocation (EVV factsheet)
Although marketed as a limited duration investment fund, I was not able to find out the average duration of EVV’s investment portfolio, as that information was not available on the fund’s website, annual report, or factsheet.
Limited Duration With Limited Returns…
Figure 5 shows the historical returns of the EVV fund. The EVV fund has delivered modest returns, with 3/5/10/15Yr average annual returns of 3.8%/1.1%/2.8%/5.1% to April 30, 2023 respectively. These returns consistently place EVV in the 3rd or 4th quartile of peer returns compared to the Morningstar funds category, Multisector Bond.
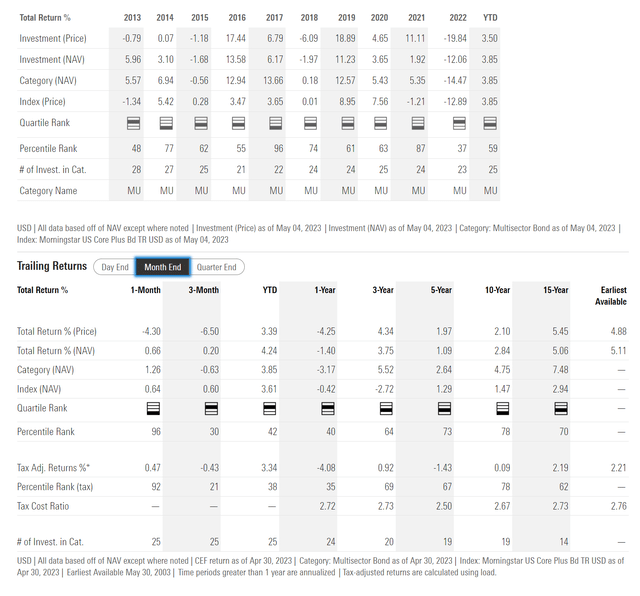
Figure 5 – EVV historical returns (Morningstar)
Notably, the EVV fund had a poor 2022, with a 12.1% loss despite being ‘limited duration’, which should have helped it avoid most of 2022’s interest rate induced fixed income losses. For example, the Invesco Senior Loan ETF (BKLN) which passively tracks senior loans, returned -1.7% in 2022 (Figure 6).
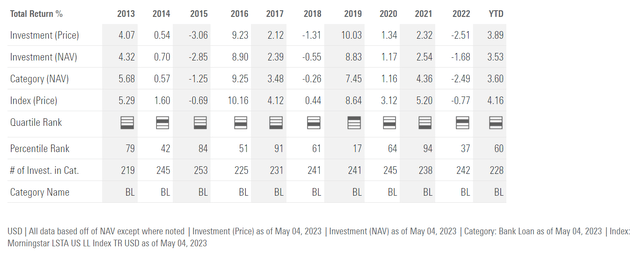
Figure 6 – BKLN annual returns (Morningstar)
Similarly, the iShares iBoxx $ High Yield Corporate Bond ETF (HYG) which tracks junk bonds, returned -11.4% in 2022 (Figure 7).
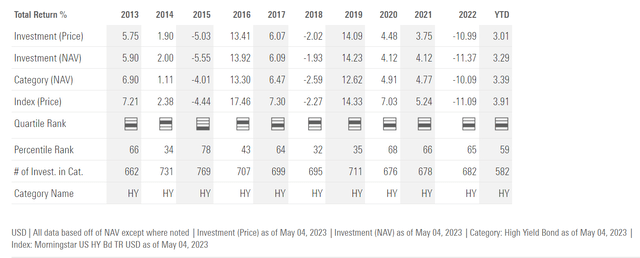
Figure 7 – HYG annual returns (Morningstar)
Finally, the iShares MBS ETF (MBB), with effective duration of 6.0 years, only lost 11.9% in 2022 (Figure 8).
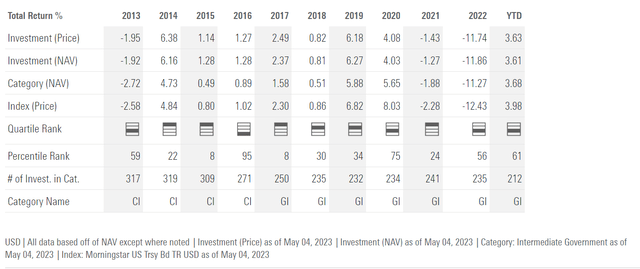
Figure 8 – MBB annual returns (Morningstar)
Given senior loans, junk bonds, and MBS are the three biggest allocations within EVV’s portfolio, one would have expected EVV’s 2022 returns to be somewhere between -1.7% and -11.9%. Instead, EVV delivered -12.1%. This suggests EVV had extremely poor security selection, or it had some other exposures with large losses that we are not aware of.
…But Pays A Generous Distribution Yield
Despite only earning low single digit (“LSD”) annual returns, the EVV fund pays a very generous distribution yield, currently set at $0.787 / month or 10.1% forward yield. On NAV, the forward yield is 9.1%.
Investors should note that the EVV fund has recently cut its distribution, as it was paying $0.10 / month for several years (Figure 8).
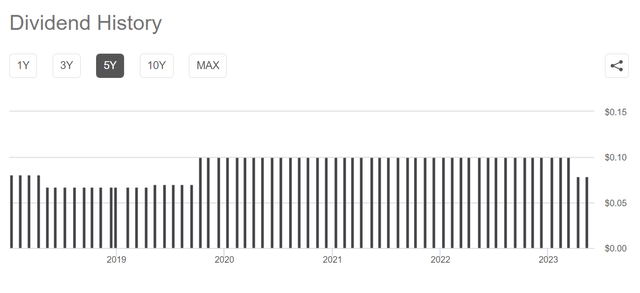
Figure 8 – EVV distribution history (Seeking Alpha)
In fact, it is quite surprising that EVV maintained its $0.10 / month distribution for so long, as the fund was clearly not earning its distribution.
For a company that published a whitepaper titled ‘Return of Capital Distributions Demystified’ that warns investors against amortizing ‘return of principal’ funds, I find it quite shameful that the EVV fund shows all the hallmarks of being a ‘return of principal’ fund itself.
‘Return of principal’ funds generally do not earn their distributions and must liquidate NAV in order to fund their distribution yields. This depletes income earning assets, making future distributions even harder to fund. In the long run, ‘return of principal’ funds are characterized by amortizing NAVs and shrinking distributions.
Figure 9 shows EVV’s NAV progression since inception with a classic ‘amortization’ pattern.
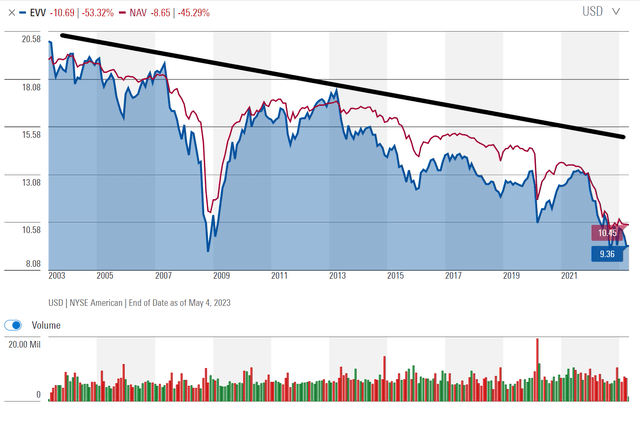
Figure 9 – EVV has classic amortizing NAV pattern (Morningstar)
Figure 10 shows EVV’s historical annual distributions per share, showing a classical declining pattern commonly associated with ‘return of principal funds’. Investors should note that Seeking Alpha’s data is not up to date, as the monthly distribution was recently cut to $0.0787 / share for May 2023, or an annual $0.94.
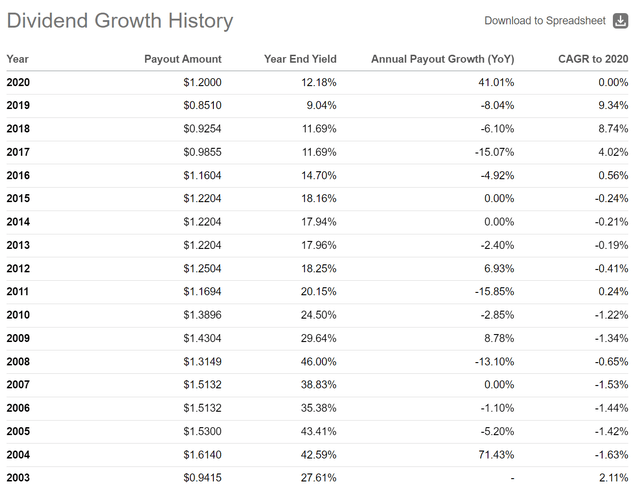
Figure 10 – EVV’s distribution has shrunk over time (Seeking Alpha)
Since market prices tend to track NAV, this means long term investors in EVV end up losing both principal and income.
Why Am I So Negative On High Yielding Funds?
Readers often ask me why I am so critical of high yielding funds. There are two points I want to clarify for my readers. First, I do not hand out buy recommendations like candy because I am writing from the perspective of an investor looking out for my own portfolio – I am willing (and often do) invest my own money into the investments I recommend.
Secondly, and perhaps more importantly, I feel strongly against these high yielding funds that appear to be set up to lure unsuspecting retirees with high upfront distribution yields. However, what these funds actually deliver is often much more modest total returns. Over time, investors in these funds recommended by many ‘income experts’ end up losing both principal and monthly income.
Invest With Common Sense
Instead of blindly following experts, I suggest readers invest with common sense. First, look at long-term (5 or 10 years) historical total returns of the funds from a trusted source like Morningstar. That tells you what the fund’s strategy is capable of earning over a cycle. Unless there is a specific reason why the fund is particularly distressed (i.e. credit funds at the depths of a credit crunch to play a credit recovery), I would recommend investors avoid funds that pay more than they earn.
For example, I can see the merits of the Franklin Universal Trust (FT), which combines utility stocks with junk bonds. The FT fund earns a solid 5-6% p.a. while paying a 7% distribution yield, so it generally earns its distribution. Figure 11 shows FT’s long-term NAV profile, which is quite different from EVV’s in figure 9 above.
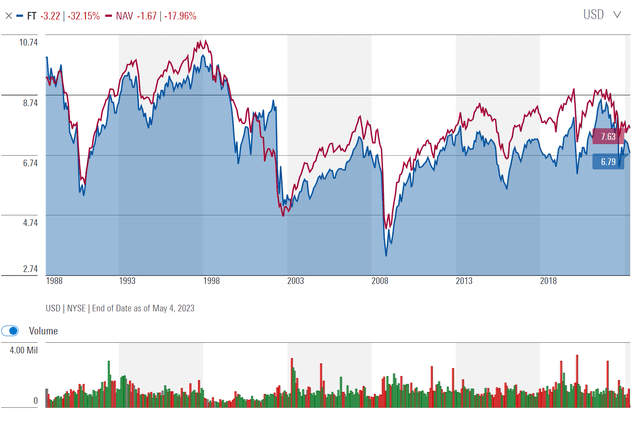
Figure 11 – FT fund’s NAV profile (Morningstar)
While I am cautious on the FT fund currently, it is because of my macro-economic views, and not a knock against the fund’s structure. I wrote about the FT fund here.
Another fund I like over the long-term is Tri-Continental (TY), which is a broad equity fund that has earned long-term average returns of 8-10% p.a. It pays a quarterly distribution yielding ~4%. However, in good years, the TY fund will reward investors with special distributions that brought its 2021 distribution to $4.69 / share or a 16.3% year-end yield. Figure 12 shows TY’s NAV profile, inclusive of the 2001 Tech bubble and the 2008 Great Financial Crisis.
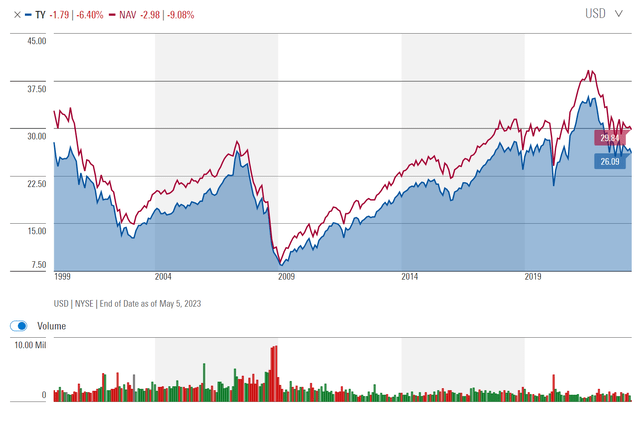
Figure 12 – TY fund’s NAV profile (Morningstar)
Unlike the EVV fund, both of the funds mentioned above do not pay a distribution yield that far exceeds the funds’ earning power.
Common sense tells us that when a person spends more then he or she earns, it will lead to financial ruin in the long run. The same principle can be applied to assess investment funds.
Conclusion
The Eaton Vance Limited Duration Income Fund appears to be yet another example of an amortizing ‘return of principal’ fund that is best to be avoided. There are plenty of better structured investment funds that do not pay more than they earn. Investors just need to tune out the cheerleaders and apply some common sense.
Read the full article here


